In this article, we will explain why Windows can lag and be slow and will tell you about popular monitoring tools that can help you find the problem. This information will be helpful for both Windows-based servers administrators and ordinary users with home PCs. The article will come in handy to those who want to increase the performance of their virtual servers on Windows.
The performance of a server depends on various factors. For our purpose, we can divide all sources of the problem into several groups: CPU, RAM, HDD, network, and software. If the cause of the problems is not obvious, it makes sense to check the above components first. Let’s take a closer look at built-in tools for the system’s performance analysis and use Windows Server 2012 R2 as an example.
Task Manager
Task manager allows us to manage processes: prioritize them, “assign”, them to certain processors, create new processes, but the most common use for it is to take a quick look at the system load and force-close applications.
How to open Task manager:
- click the right mouse button on the taskbar and choose “Task manager”
- enter command “taskmgr” in the “Run” window or command line.
- press “Ctrl+Alt+Del” and choose “Task manager”
- press “Ctrl+Shift+Esc”
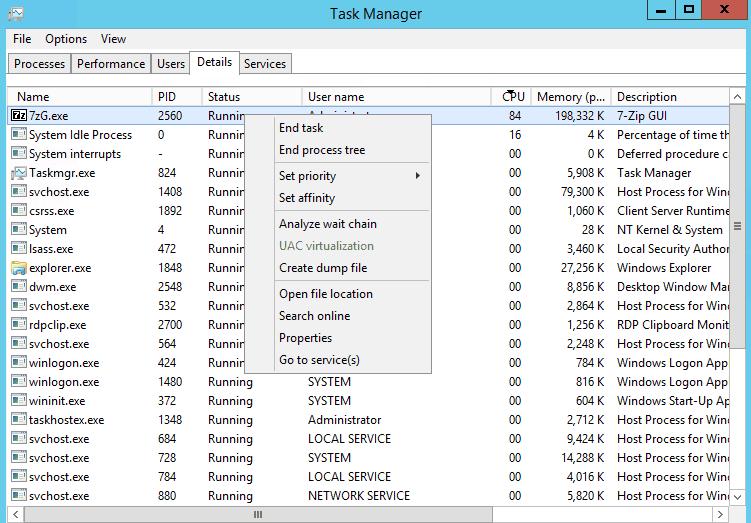
The Task Manager displays real-time metrics for every active process: memory footprint, processor load, etc. You can also find more detailed info in the “Details”. You can click any top section of a column to sort the rows by the column’s value. To force-close a process, click the right mouse button on the process and choose “End task”. There are a few other actions in the contextual menu as well.
If there is more than one user working with the server, you’ll find useful this “Users” tab where you can see all processes sorted by the user. Click the right mouse button to open the contextual menu with all available actions. An administrator can send a message, switch off, or terminate a user’s session.
In the “Services” tab, you will find information on all services, and you can start, stop, or restart any service from the contextual menu as well. In the “Processes” tab you will see processes are grouped by type and in the “Performance” tab, graphic presentation of the load on all components of the system.
Thus, in the Task Manager, a user can see minimal sufficient information about the system’s load that can help you conduct initial analysis of what slows down Windows.
Resource Monitor
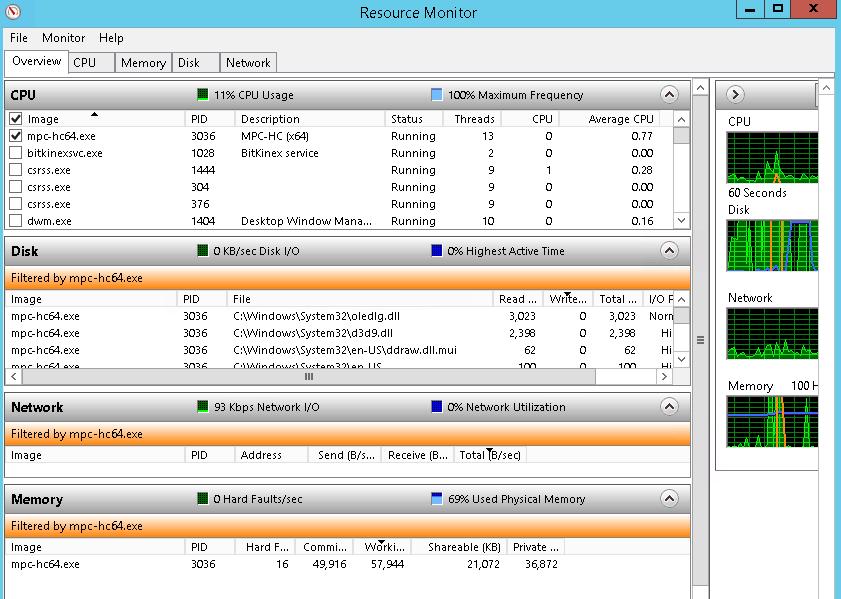
The Resource monitor contains more detailed information in case you need it. Besides CPU load and RAM, you can see “read” and “write” operations, files opened, related services and libraries, and network activity in real-time.
Want to know how to open Resource Monitor? We have a few options for you:
- click “Open Resource Monitor” in the “Performance” of the Task Manager window;
- enter “resmon” command in the command line or “Run” window;
- choose “Resource Monitor” in the “Tools” menu of the services manager
Information in every tab of the Resource Monitor is presented as tables and graphs. To vary the set of columns in the tables you need to click the right mouse button at the top section of any column and choose “Select columns”. If you tick any process in any tab, the information in all other tabs will be sorted by the chosen values.
Information on CPU activity, memory, disks, and network are presented in separate tabs, and the “Overview” tab contains cumulative information from all components.
Let’s take a look at some useful capabilities of Windows’ Resource Monitor.
Finding a process that is blocking a file
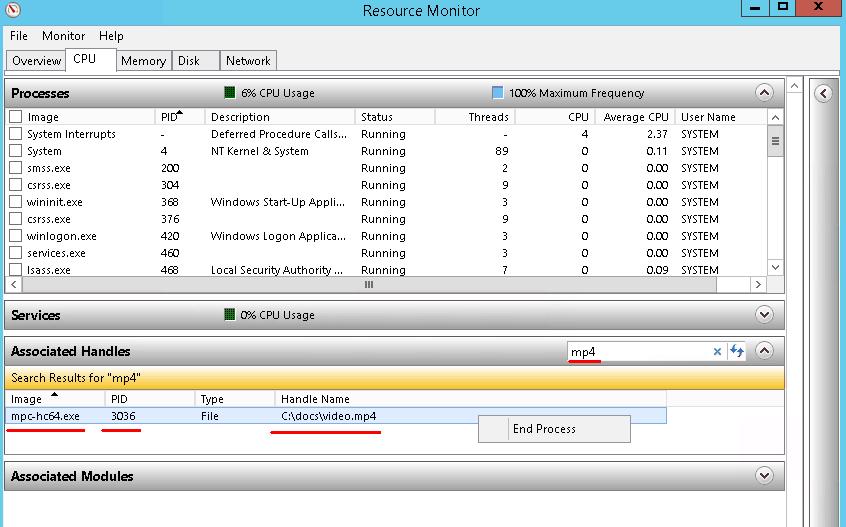
There may be a situation when while trying to delete or edit a file the system shows an error message saying that the file is used by another application and thus can’t be edited or deleted. In order to find the process that is blocking the file, you’ll need to enter a part of its name in the “Associated handles” section in the “CPU” tab. End the process if necessary.
Disk activity monitoring
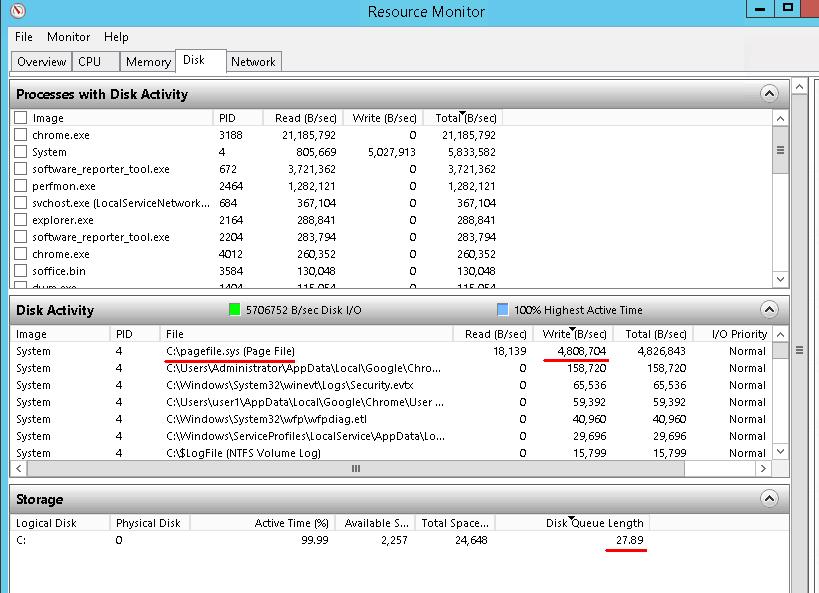
In the “Disk” tab you can see read-write operations conducted. On the screenshot, you can see an example when the system actively addresses swap file “c:/pagefile.sys”, which is usually slowing down the system and indicates a lack of RAM available.
Also, pay attention to the “Disk queue length” metric. Normally, it shouldn’t exceed the number of disks more than two times. If there’s just one physical disk installed, the queue should not be longer than 1-2.
Frequent hits of this metric and long activity time may indicate the low performance of the disk subsystem.
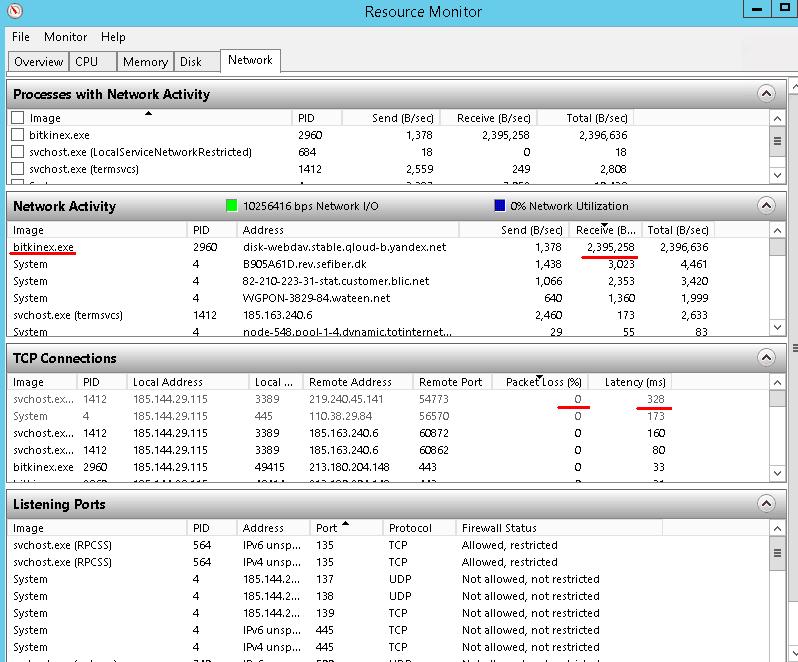
Network activity monitoring
In the “Network” tab you can find processes that load your network too much. I can be some 3rd-party application (as exemplified on the screenshot) or internal processes. An automatic system update would be a good example.
In the “TCP-connections” section you’ll find useful metrics like “Packages lost” percentage and “Latency” that will help you estimate your network connection.
Moreover, in the “Network” tab you will find listening ports and firewall status.
Task manager and Resource manager will help you find the problem only under the condition that it’s happening at the same moment when you conduct the analysis. However, often a problem can appear occasionally. Thus, we’ll describe some monitoring tools for monitoring the state of your system during a certain period.
Performance monitor
Performance monitor allows you to track metrics of various system objects of the operating system. For example, the object “Physical disk” has the following metrics “Disk activity %” and “Average disk queue length”, and the object “Memory” has metric “Pages output/с”.
How to open:
- choose “Performance monitor” in the “Tools” menu of servers manager;
- run “perfmon” in the command line or “Run” Window;
- choose “Performance monitor” in the “Administration” section of the control panel.
Performance monitor consists of three main components: “Monitoring tools”, “Data collector set” and “Reports”. In the “Monitoring tools” section you can find a tool to monitor counters in real-time or view reports saved earlier. “Data collector set” contains a set of monitors that we will observe. For our system analysis, we can use existing system groups or create new ones. In the “Reports” section you will see saved results of monitoring.
Let’s take a closer look at our analysis using an existing set of data collectors in “System Performance”
1. Go to the “Data collectors set” section - “System” and launch “System Performance”
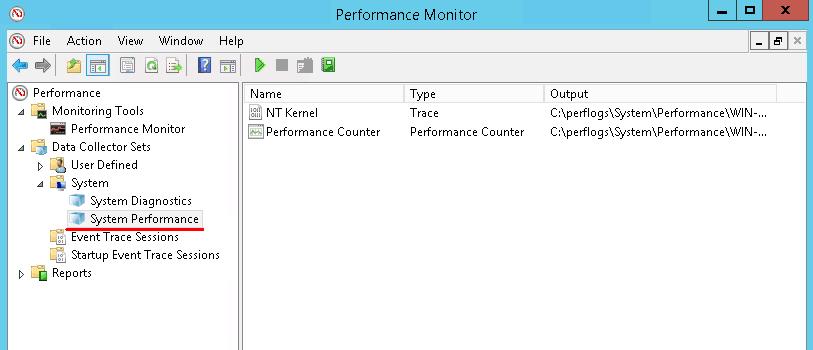
2. Wait until the data is collected - 1 minute by default and then open the new report in the “Reports” section - “System Performance”
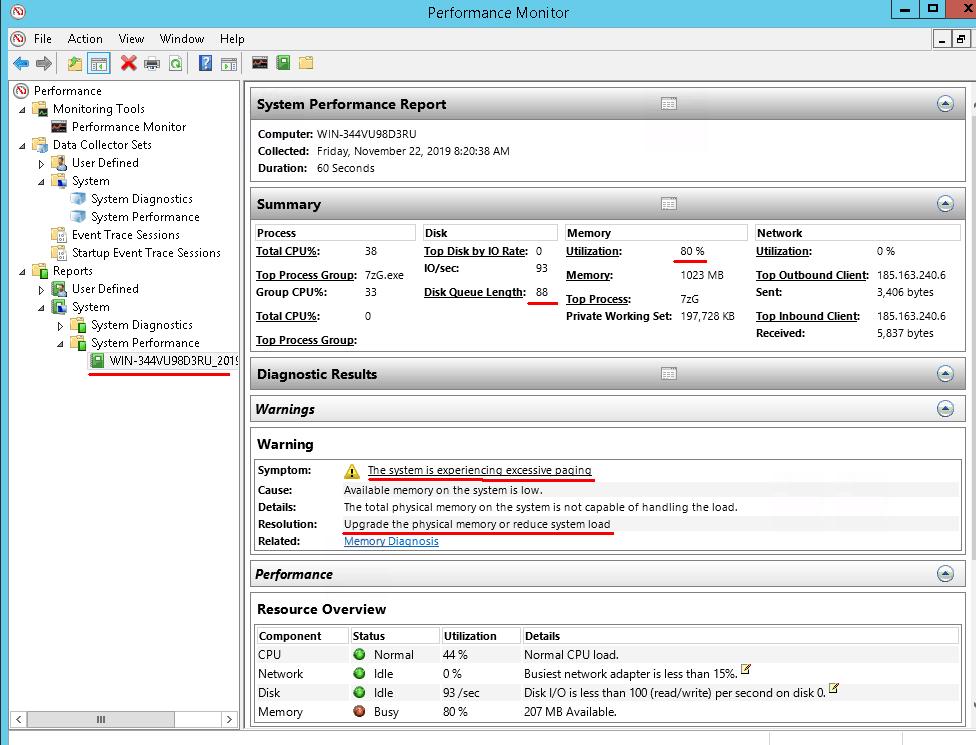
At the top of the report, you can see cumulative information from the main system components and some recommendations if any problems were detected. The analysis detected a lack of RAM on our test server.
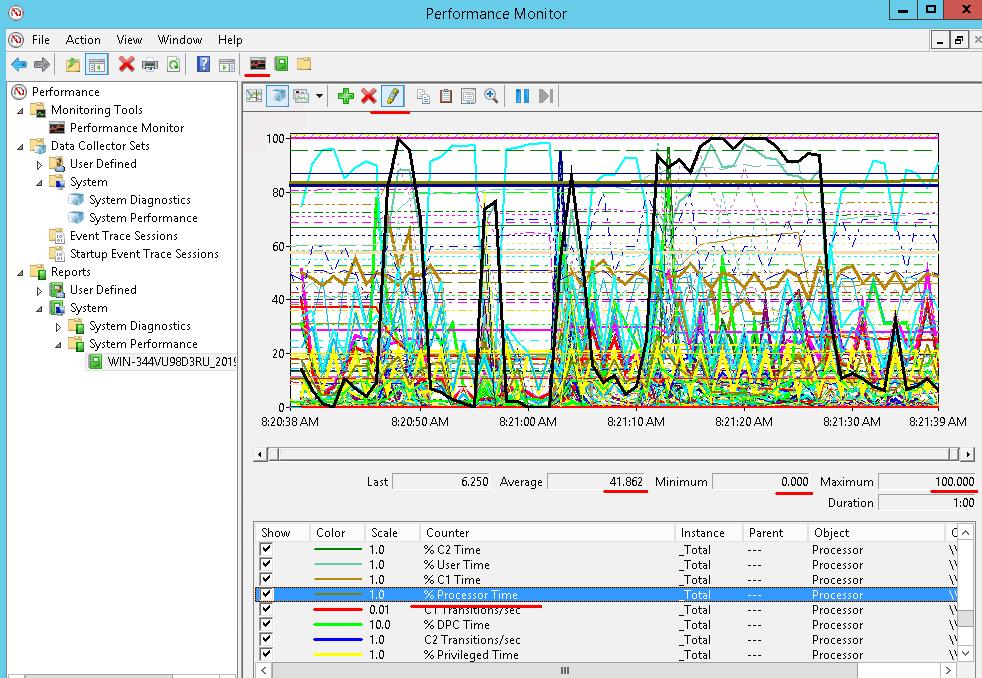
To see how counters were changing during the data collection process click “See data in Performance monitor”. After that click any counter you like at the bottom of the screen, for instance, “CPU load %” and click “Highlight” in the toolbar to highlight the graph with a bold black line. Under the graph, you will see the average, maximum, and minimum values of the chosen counter.
As a rule, all reports are saved as ordinary files to the “c:\Perflog” folder, so you’ll find it in no time and put it anywhere you need.
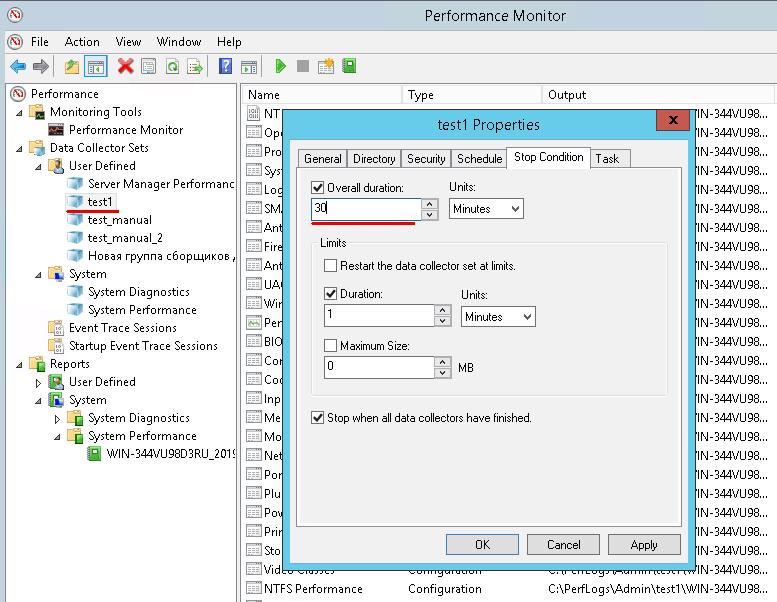
Built-in data collectors set are not editable, but for the ones you created manually you can set different parameters, such as duration of data collection, or scheduled time.
In order to create a group, you should click the right mouse button on the “Special” folder in the “Data collectors set” section, select “Add” - “Data collectors set” and follow the instructions of the wizard. If you click the right mouse button on a group you created and choose “Properties” it will open a window where you can edit default parameters.
Event Log
All important changes in the operating system are recorded into Events log, whether it is a launch/stop of service, update installation, reload, reading from disk error or application failure. Events are divided into information, critical, error messages, and warning events.
If your Windows is lagging, being slow at times or fails at times, or maybe an application is working unstable, there’s a good chance that you’ll find records related to the problems in the Event log. By these records, you’ll be able to find out what’s causing problems.
How to launch the Event log:
- choose “View events” in the “Tools” menu of the Task Manager.
- choose “View events” in the “Administration” group in the control panel.
- run “eventvwr” in the command line or in “Run” window
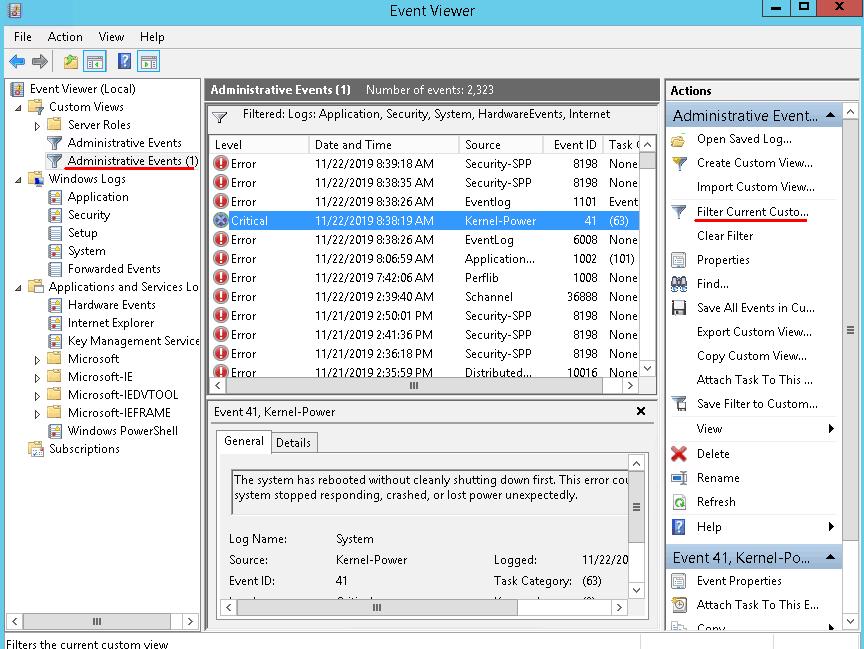
Logs are located in the “Windows logs” and “Applications and services” sections. More likely the information about errors will be located in the “System” log of the “Windows logs” section. However, if you know beforehand what exactly you’re looking for, existing view “Management events” where you can see information from all main logs. You can not edit an existing view, so if you need to change the logs or events categories, create your view or copy an existing one.
Click the right mouse button on the “Management events” view and choose “Copy editable view”, click “Ок” in the opened window. As a result, you will see your new view “Management events (1)”. To edit this view select it and click the button on the right side of the window “Filter current editable view”.
You can set the output for errors and critical events only to conduct the analysis.
Reliability monitor
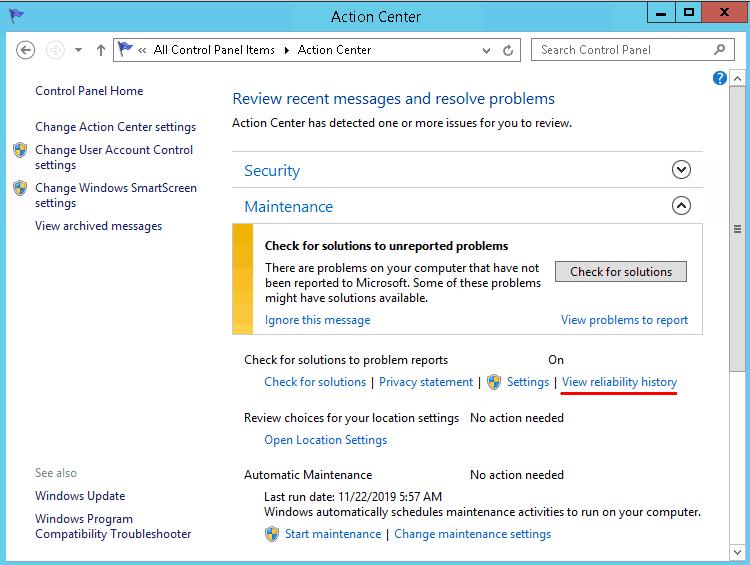
Reliability monitor can be considered as an addition to the Events log. To launch it you need to open “Control panel”, go to “Support center” and click “Show reliability log” in the “Maintenance” section.
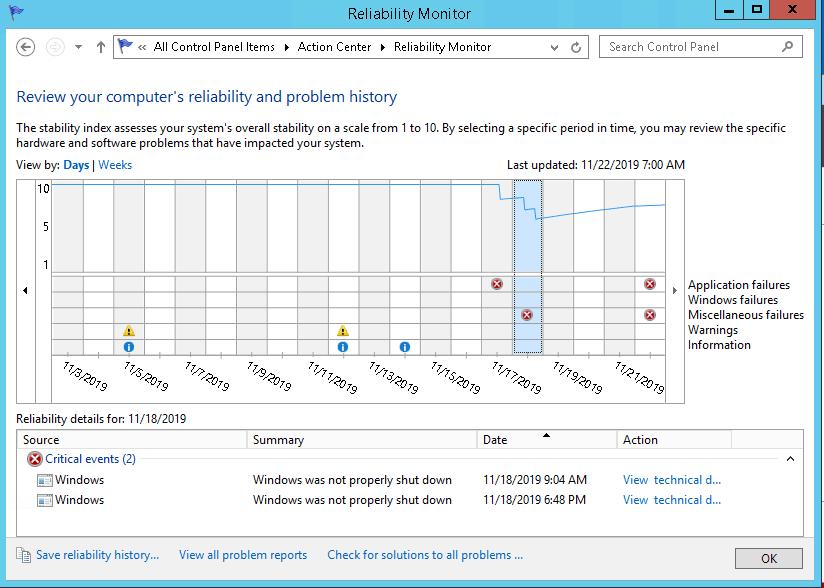
Events in the monitor’s window are grouped by date. If you select a certain date, you will see the list of related events at the bottom of the screen. You’ll also see the reliability line at the top of the screen depending on the criticality level. This will help you estimate failure dynamics.
The tools that we have described are complementary to each other. That’s why using them in the complex will provide you with the most detailed information about your system.
These tools can help to find most of the problems with Windows. Quite frequently these problems can be detected and eliminated which lets you recover the system’s performance without re-installing Windows.