Looking Glass is a useful tool for analyzing network routes and diagnosing network connections between your computer (or server) and the data center. It allows users to access information about the network infrastructure and test routes from the provider's point of view, i.e. "from inside" the data center:
- Check availability and latency to your IP address or domain
- Determine the route packets take
- Assess the quality of communication with a specific region or operator and identify potential problems
- Diagnose problems with latency, packet loss, or unstable routing
How to use it
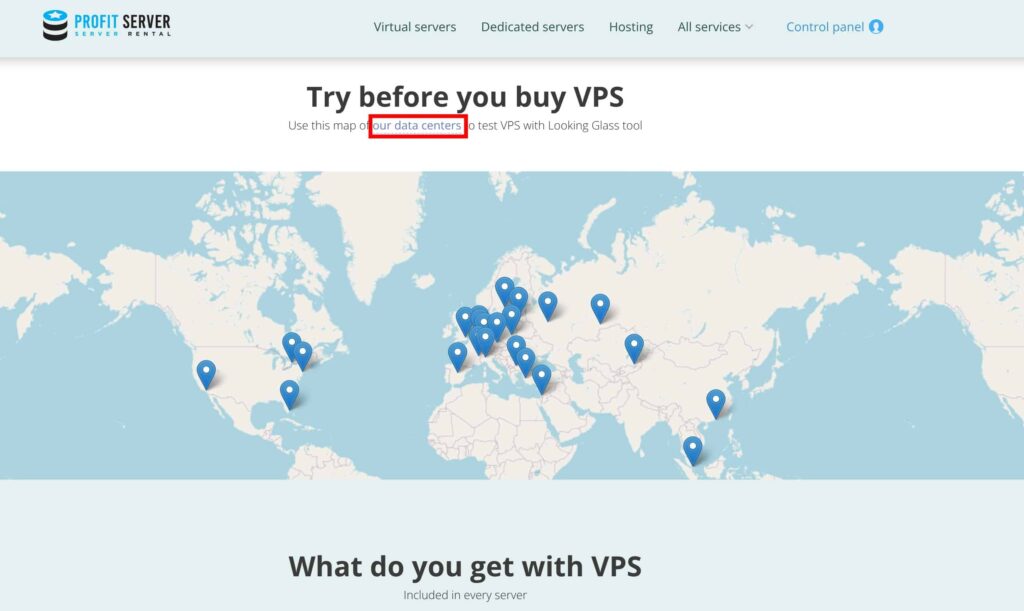
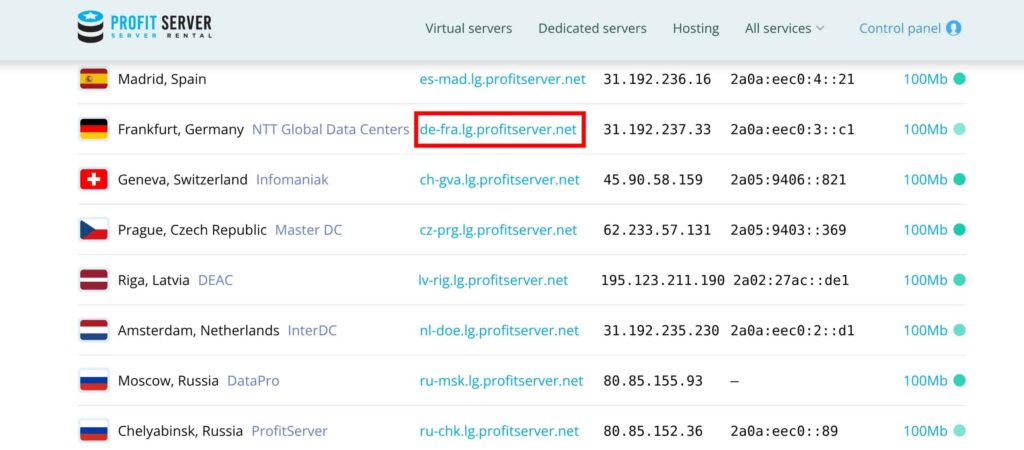
The page contains information about the data centers where the company's servers are located. For each data center, there is a link to the corresponding Looking Glass - you can select the location you are interested in (for example, Amsterdam (Netherlands), Los Angeles (USA), Moscow (Russia), etc.) and go to the testing page. Let's choose the location Frankfurt, Germany.
Use our Looking Glass tool to check download and upload speed and execute host, addresses in ipv4 and ipv6 format (if available), ping, traceroute, and mtr commands from many Looking Glass points located in data centers in countries around the world to be sure that the server meets your requirements.
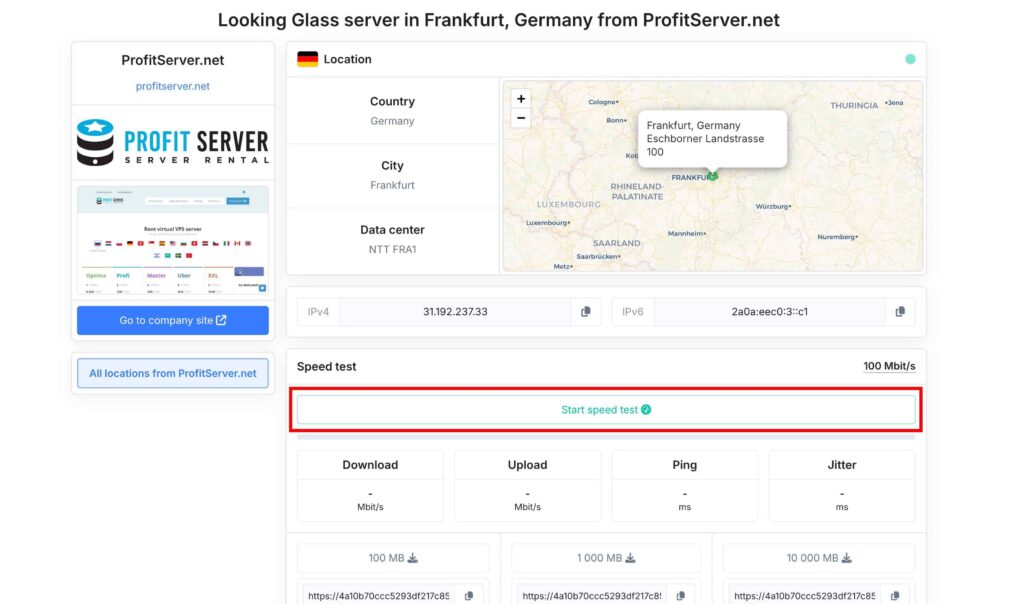
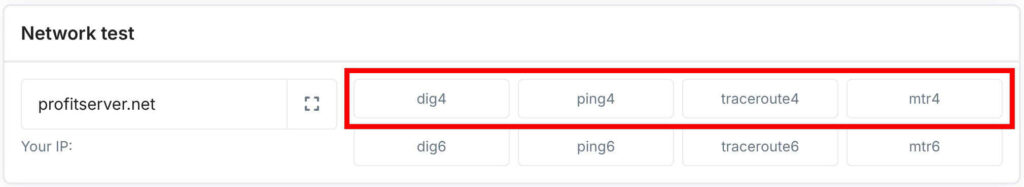
Tests available in Looking Glass: basic speed test checks the connection speed between your device and the ProfitServer data center, and shows ping. Possibility to download test files of 100, 100, 10000 MB. Network tests include the commands ping, traceroute, mtr, dig. We will tell you more about each of these commands.
Ping
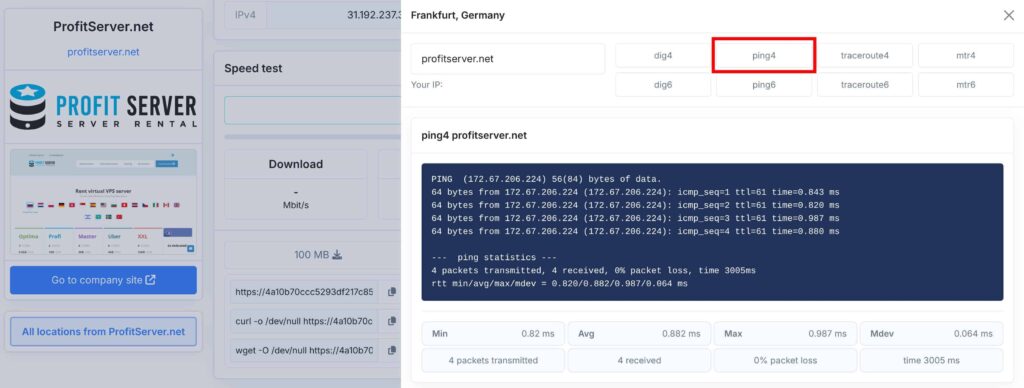
Sends packets to the specified IP address or domain and measures the response time. This is a basic availability and latency check. Enter your IP address or website (for example, profitserver.net), see the average response time and whether there are any losses.
Traceroute
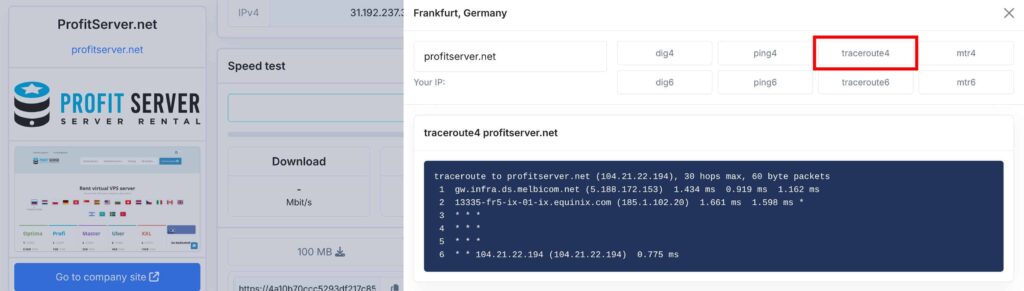
Shows the entire route from a server in a data center to your destination, including all intermediate nodes. Helps you understand where exactly delays or problems occur, see which countries and providers your traffic passes through. In a traceroute command output, an asterisk (*) indicates that a response was not received from a specific hop within a specified timeframe. This can happen for various reasons, including the router not responding to ICMP requests, the router dropping packets, or the router being configured not to respond.
Values of the main fields in the traceroute output:
1,2,3, ... - The order of routers on the path to the destination, which starts at 1IP Address and Hostname- The IP address and hostname (if resolved) of the router at that hop. This is helpful when you need to identify a potential suspect device that could be causing your network problemsx.xxx ms- The time in milliseconds it takes to receive a response from that hop, which helps identify latency if you are experiencing poor response times.
MTR
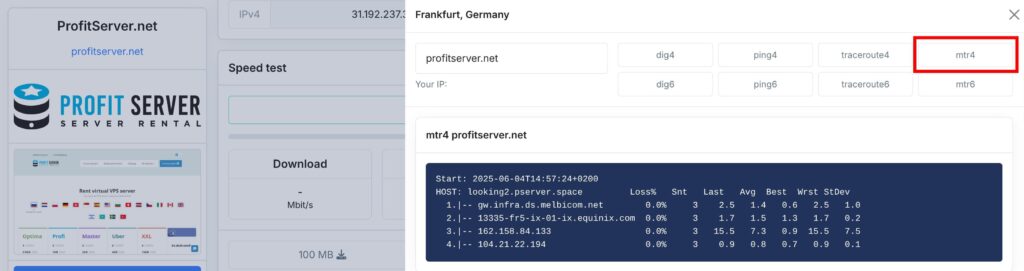
Displays statistics on packet loss and delays at each node in the route. Provides a more accurate picture when the connection is unstable.
Explanation of the main fields in the output mtr:
HOST- IP address or hostname of a hopLoss%- Indicates the percentage of packets lost at each hop. It's a critical measure of network reliability. Lower loss percentages are preferableSnt- Displaying the number of packets sent to each hopLast- Represents the last recorded round-trip time (RTT) to the hopAvg- The average RTT for packets sent to that hopBest- The best (lowest) RTT recorded for that hopWrst- The worst (highest) RTT recorded for that hopStDev- The standard deviation, indicating the variance in RTT values
Dig
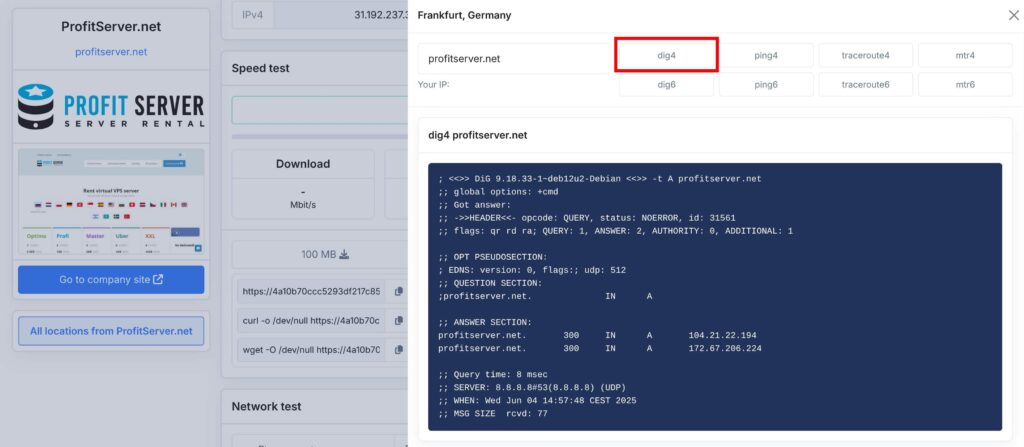
Dig is a powerful command-line tool used for querying DNS (Domain Name System) servers. It provides detailed information about domain names, IP addresses, and DNS records. Let's say you want to query the A records (Address records) for the domain profitserver.net.ANSWER SECTION is the main block of the dig command output that shows the result of the DNS query: what data the DNS server returned in response to your request.
profitserver.net- Имя домена, к которому относится запись300- Time to Live (TTL) - how many seconds before the recording expiresIN- The query type (IN= Internet).A- Record type (in this case,A, i.e. IPv4 address)104.21.22.194;172.67.206.224- IP addresses associated with the domain
Looking Glass service from ProfitServer is a powerful tool for analyzing and diagnosing network connections. It allows you to get objective information about the quality of communication with various data centers, which is especially useful when choosing a server location or troubleshooting network problems.