When a server is overloaded, whether virtual or dedicated, it causes websites to load slowly and produce irritative errors instead of content. It is necessary to carefully monitor its parameters and conduct a timely analysis of resources in order to avoid such an outcome,
Next, we will look at diagnosing individual resources using the hosting provider's tools, as well as through the terminal on the server side. In addition, we will consider various approaches to solving problems associated with poor system performance. The instructions apply to any servers running Linux OS, regardless of the preinstalled software.
Checking server resources via VMmanager
VMmanager virtualization tool is the simplest, but at the same time universal solution for diagnostics. It plays a key role in ensuring efficient management of dedicated or virtual servers on most modern hosting providers. As an example, the check will be performed on version 6 of the tool, however, previous versions may also conduct similar diagnostics.
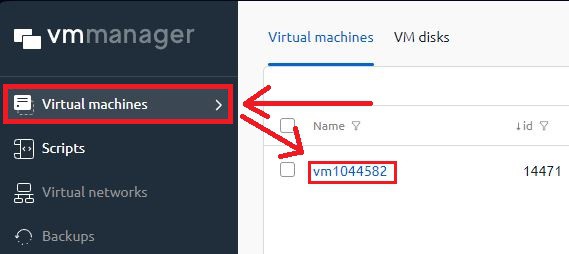
For analysis, you need to go to the VMmanager control panel and select the desired virtual machine:
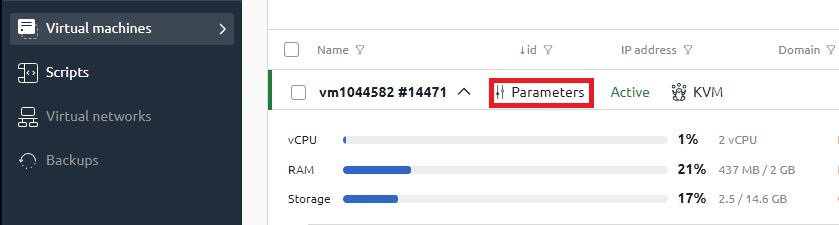
Next, the user can immediately see the use of resources in real time. For more detailed statistics, you need to select “Parameters”:
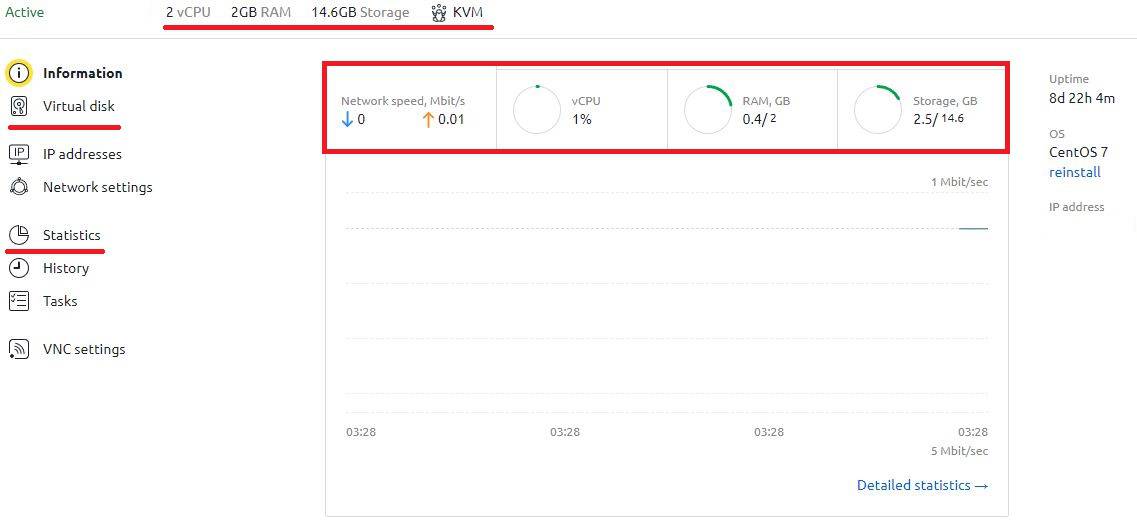
The detailed statistics tab at the top displays the general server characteristics and the virtualization type. On the graphs you can see network congestion, processor load, RAM and disk space usage in real time:
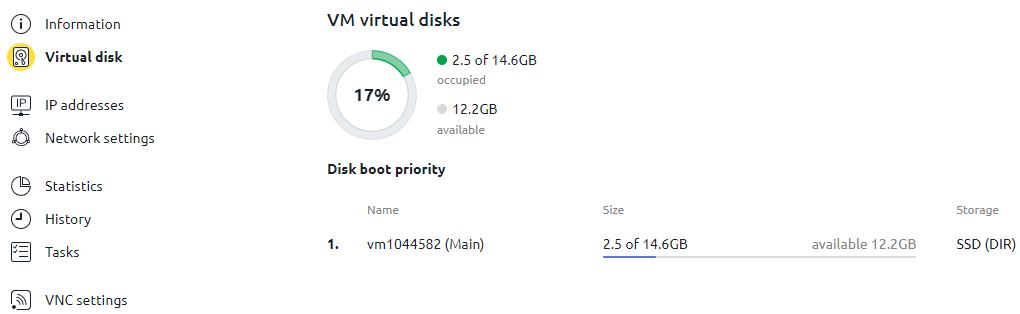
For a more detailed analysis of disk space or resource statistics for a certain period of time, you must select the appropriate menu item. Information about virtual disks is displayed in this format:
Load statistics for a specific resource are displayed in the form of a convenient graph:
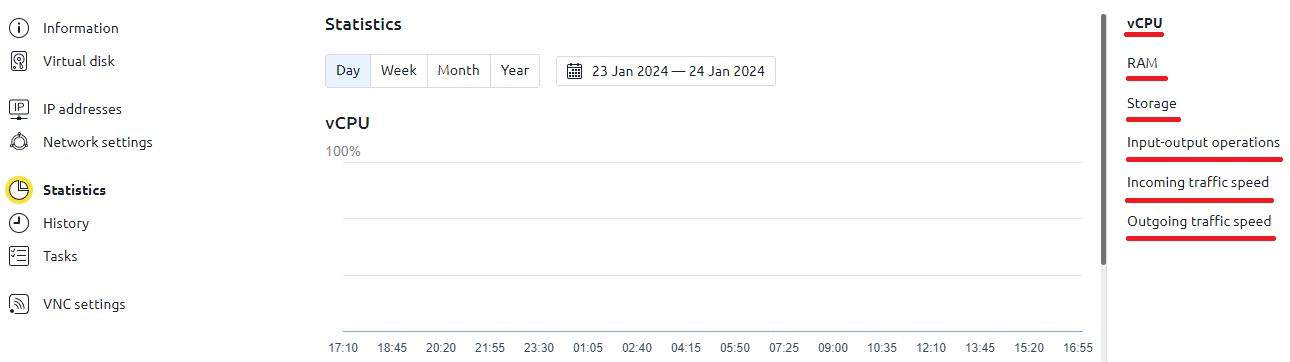
It is possible to display a load graph for a day, week, month, year, or manually select the necessary dates. All main resources are displayed: processor, RAM, storage, network interface.
Many users expect resources to be used evenly over a certain period. However, this is not always the case. For example, the network interface may look similar even in idle mode:
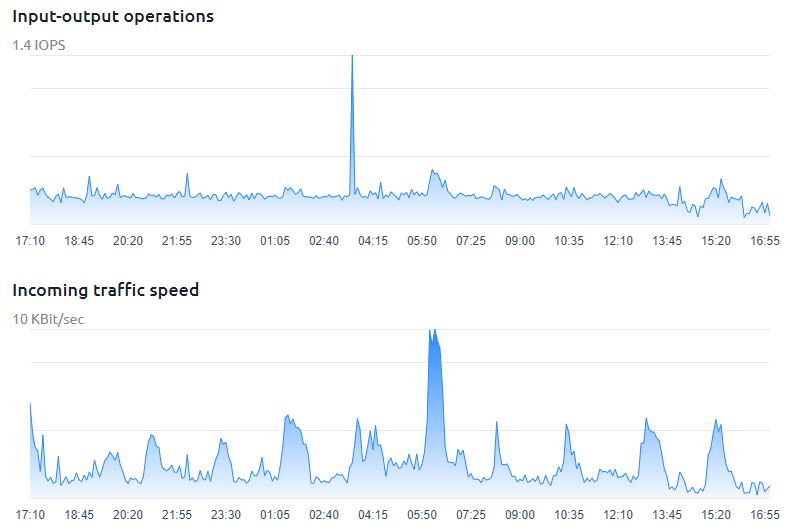
No measures are required in this case. However, in the case of a processor, RAM or disk storage, the server should not use all 100% of its resources on a constant basis; the recommended load is no more than 70%.
Checking server resources in the terminal
Total load analysis
We have previously looked at some analysis options in the General diagnostics of server resources article. There we talked about standard tools such as top/atop, and also looked at installing and configuring the Netdata utility, which allows us to monitor server resources via the browser. In this article we will look at htop as an alternative to the top utility for general system resources analysis.
The tool is not preinstalled in Linux distributions by default, so let’s start with installation. For Debian/Ubuntu we use the command:
apt-get install htopFor CentOS, it makes more sense to use the EPEL repositories. They are disabled by default, so the first command is responsible for adding them, and the second one is for installing htop:
yum -y install epel-release
yum install htop -y
Right after installation, you can open the utility from the application menu or in the terminal with the appropriate command:
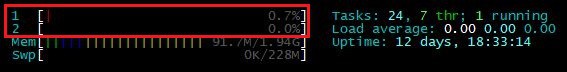
htopAs a result, the user will be able to see all the information about the system:
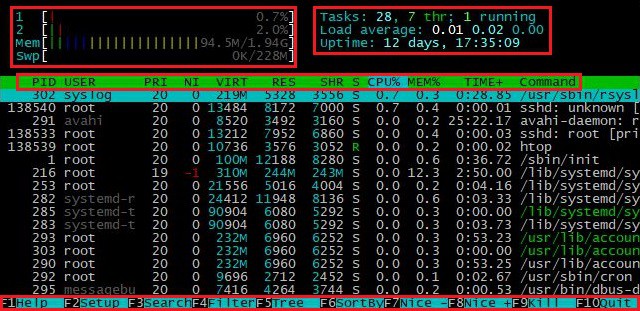
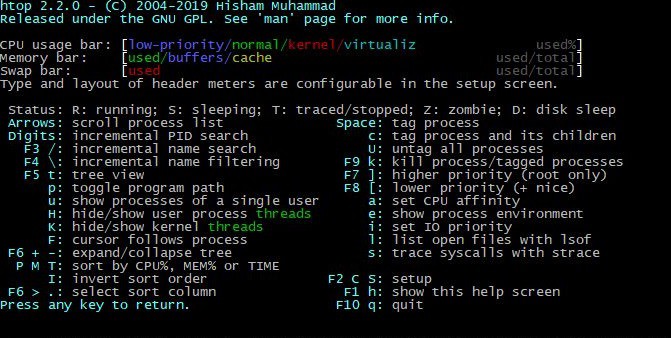
The top left corner displays processor data, including the use of each core, RAM and swap memory. Swap memory in Linux is used in cases of a RAM shortage, ensuring system stability. In the upper right corner you can see the processor load and the number of active tasks. The central part shows active processes with the ability to sort. The lower part provides information about hot keys and functionality. The “Help” section contains a detailed description of the program’s capabilities:
Before diagnosing the system, itself, it is necessary to understand exactly how many cores/processors are used on the server. The user can find out their value in the upper left corner of the htop utility:
Or by running the command:
nprocDepending on the obtained value, the permissible total load will be calculated (Load average in the upper right corner). In our case it is equal to 2, which means the maximum load is 2.0. However, this does not mean that the system will freeze completely under load 2.0. This number may be higher, but in this case, all other tasks will be in the queue, and the server itself will be loaded. The ideal value is considered to be a load of no more than 70%. For example, the Load average should be within 0.7 on a single-processor server. In the case of the server in the above-mentioned example, a good indicator would be values no higher than 1.4.
Using htop or its analogues, the user needs to evaluate the main resources: average processor load, RAM usage, disk space and network interface. If resources are minimal, you need to sort processes by CPU usage, identify high-consuming operations, and then optimize or terminate them. If it is impossible to close the program or optimization fails, it is recommended to consider switching to a server with a more powerful configuration.
Checking free RAM
In this section, we will take a closer look at an important aspect of the functioning of any server - a sufficient level of free RAM.
The easiest way to check free RAM on any Linux system via the terminal is the command:
free -mAt the output we get the following data in megabytes: total, used, free and cached RAM, as well as swap volume:

The tool is useful for obtaining general data at a specific point in time. For dynamic RAM usage diagnostics, we recommend the vmstat utility, which allows us to configure the update frequency of the output information:
vmstat 1In the above example, the data will be updated every second. The output is produced in a format similar to free:
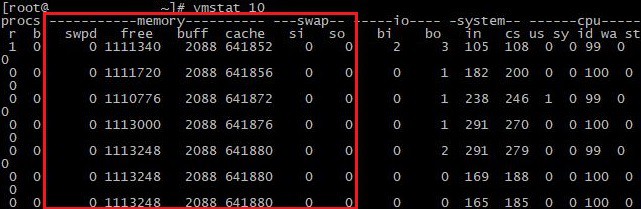
The tool also provides general system information, but in our case, only the columns that are responsible for RAM, that is, memory and swap, are important. All values are indicated in kilobytes. Let's look at them in more detail:
Memory (RAM):
- swpd: virtual memory exchanged for physical.
- free: available physical memory (RAM).
- buff: memory used as a buffer before disk write.
- cache: memory used as cache to speed up access.
Swap
- si: memory used as cache to speed up access.
- so: data written from physical memory to swap memory.
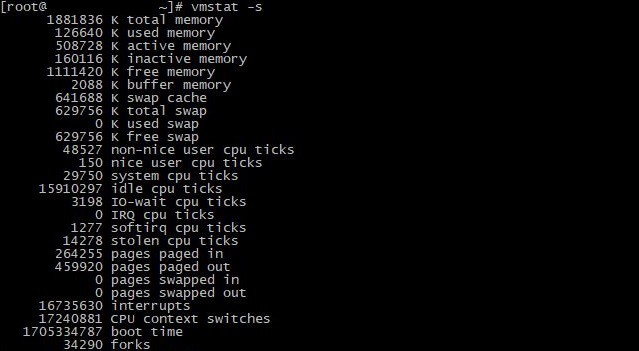
Separately, it is worth mentioning the fact that all system resources diagnosing utilities initially take data from logs. In the case of RAM, the user will be able to view the data directly by opening the corresponding file:
cat /proc/meminfoThe output is quite extensive, but it is enough to pay attention to the first records to analyze memory:
Problems with excessive RAM usage are most often related to a specific task or process. In the beginning, diagnostics using common tools in order to identify problematic processes will be enough. As a solution, you may consider optimizing a specific application, enabling caching and data compression if we are talking about large amounts of information, or increasing the server configuration.
Disk space control
Diagnostics of server disk space is no less important than its other resources. As a rule, signals about the need for checking are: the inability to create or write to existing files, slow system performance and various input/output errors.
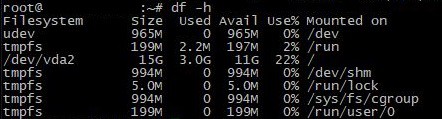
The most convenient way to check is the command:
df -hIn response, the tool will show information on all mounted disk partitions:
You can use this command for more detailed directories monitoring:
du -hs /*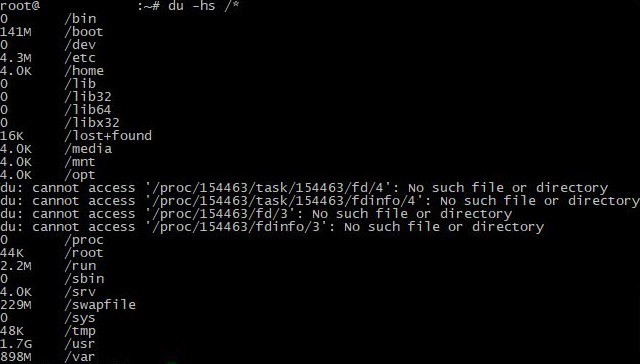
This way, the user will be able to find out how much space each directory takes up. To restore system performance, you will need to optimize the partition of the disk that consumes the most amount memory. It is recommended not to allow more than 80-90% of the free space of the total amount to be used; the remaining 10-20% should be enough for stable system operation. It is recommended to increase disk space if optimization is not possible. This can be performed by adding new or expanding existing disks, as well as using cloud storage. Regardless of the solution chosen, it is recommended to always make a backup copy to avoid file loss.
Network interface check
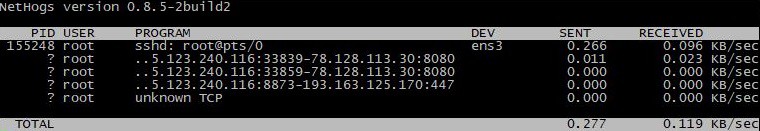
The final, but no less important aspect of server diagnostics is checking the network interface. The nethogs utility can be used if you want to gain general information about how much traffic is accounted for by network processes in real time.
Installation and launch on Cent OS:
yum install nethogs
nethogs
For Debian/Ubuntu:
apt-get install nethogs
nethogs
The tool will show those processes that are using network resources at the moment:
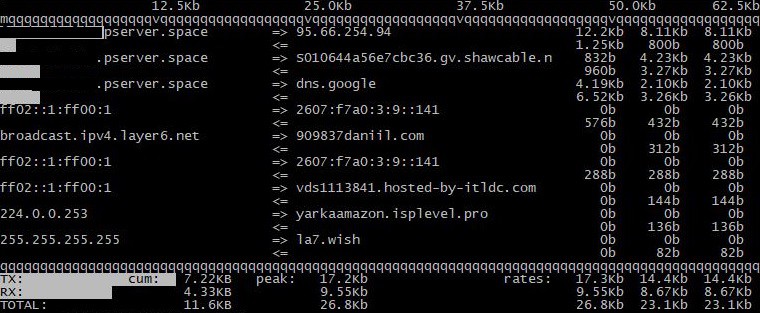
We recommend using iftop for more detailed analysis.
Installation and launch on Cent OS:
yum install iftop
iftop
For Debian/Ubuntu:
apt-get install iftop
iftop
The program output is a list of active connections indicating IP addresses, ports, amount of data transferred and transfer speed. The main program advantage is the visual design of the network channel loading:
After diagnosing the server network channel and identifying problems with high load, it is recommended to increase the bandwidth of network connections on the hosting provider’s side or optimize the settings of the specific problematic interface. As a backup tool, you can use various monitoring systems to quickly track changes in network activity and, if necessary, regularly update the network infrastructure in accordance with the requirements.
Conclusion
In conclusion, it can be emphasized that diagnosing server resources is an integral part of effective management of virtual and dedicated servers. The article provided us with the possibility to look at the main tools for a full server analysis, and also gave practical recommendations for troubleshooting possible problems. Regular system diagnostics allow the server to function seamlessly, even without active user participation.