Regular server load diagnostic is critically important for the efficient operation of servers. Server load diagnostic allows the identification of potential issues, performance optimization, and ensuring continuous operation. Typically, such procedures include the assessment of individual hardware components, software, network settings, and operational data.
In this article, we will examine the main methods of server resource analysis through the terminal and also touch on tools for automatic monitoring in the browser. The instruction is applicable to any type of dedicated or virtual servers on any Linux operating system, regardless of the pre-installed software.
How to Check the Overall Load on the Server in Terminal
To check the overall load of the server directly in the terminal, popular utilities such as top and atop will be used. In most cases, they are already pre-installed. Just launch the command:
topIn response, the tool will provide information about the current state of the system in real-time:
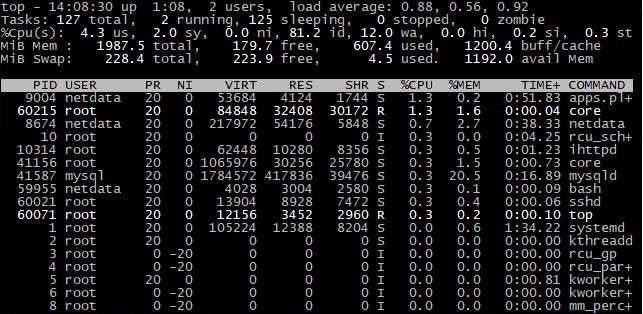
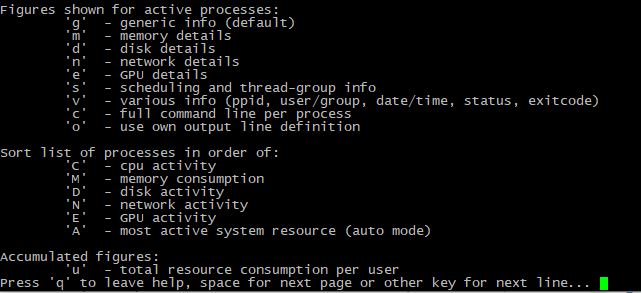
This way, the server administrator can not only track general information but also about a specific process, using keyboard navigation. However, the program also allows for a deeper analysis. For this, in the main window of the utility, press the "F" key, after which it will be possible to select additional fields:
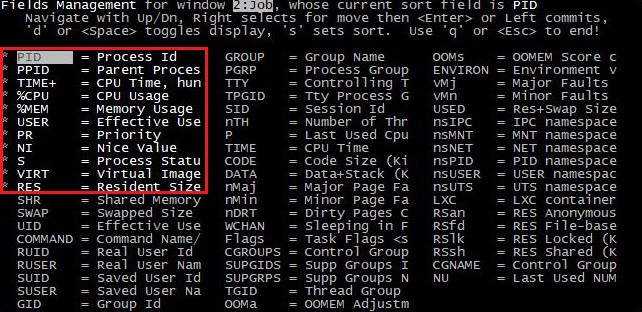
Active fields are highlighted in bold, become lighter than the rest, and are accompanied by a symbol *. To activate a specific field, use the keyboard navigation, then press space or the "D" key. To exit the fields window and the program in general, press the "Q" or "Esc" key. The newly added fields can be seen by returning to the main window and scrolling right also using the arrow keys on the keyboard:
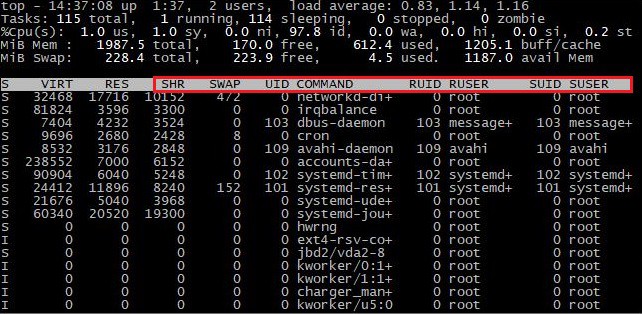
It's important to save the current settings when exiting by pressing the "W" key.
The next tool in line is atop. It's launched with the command:
atopImmediately after launch, it displays information about the system:
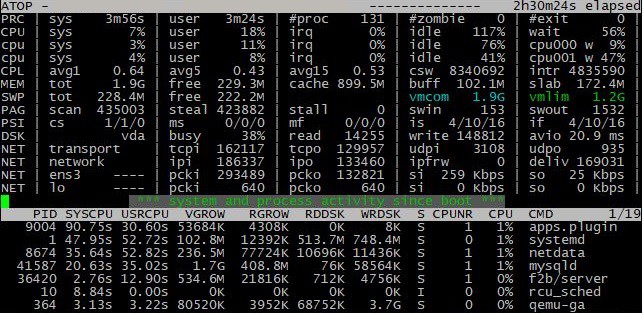
It has almost identical functionality for monitoring but also allows tracking information about the network and disks. You can familiarize yourself with all available functions by the "help" command:
In most cases, administrators use this tool to view logs for a specific period. This can be useful when you need to know the load for the past period, for example, overnight. To view logs, use the command:
atop -r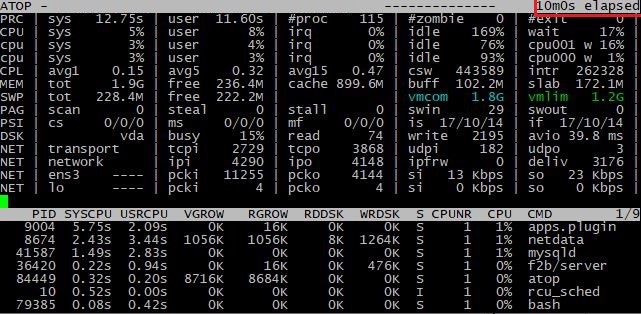
For navigation, use the "t" key — forward in time, "Shift +t" — backward.
By default, atop writes logs every 10 minutes and saves them in the /var/log/atop directory. To change the interval or path for saving, you need to open the configuration file /etc/default/atop and make the following changes:
INTERVAL=60
LOGPATH="/var/log/atop"
OUTFILE="$LOGPATH/daily.log"
In the example provided, logs will be saved every minute to the specified path and file name. After that, you need to restart the program with the command:
systemctl restart atop.serviceHow to Check the Overall Load on the Server in Browser
Using third-party tools in the browser provides a more visual picture of what's happening on the server. Such tools are aimed at comfortable analysis without the need to switch between programs in the terminal to find a specific function. One of the most functional solutions is NetData. It is completely free and yet has everything necessary for full server diagnostic. Let's consider its installation and configuration in detail on the example of a dedicated server running OS Ubuntu 20.04.6:
apt-get install netdata –yImmediately after installation, proceed to setup. Open the main configuration file:
vim /etc/netdata/netdata.conf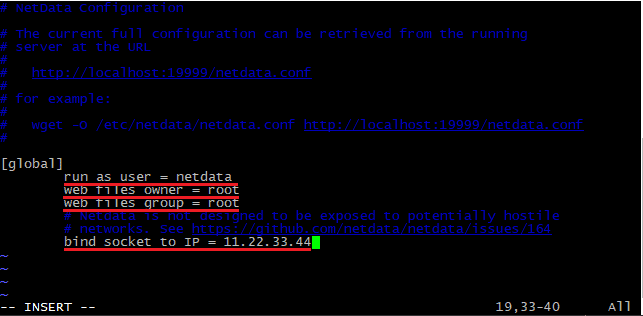
Compare the first three values, they should be similar, and also specify the external IP address of the server. It is by this that further access to the control panel will be made. Save the changes in the file and exit. Restart the service:
systemctl restart netdataCheck the operability:
systemctl status netdata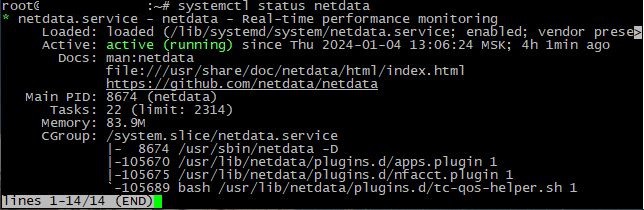
The service is launched. It remains to go to the control panel. For this, open the browser and go to:
http://11.22.33.44:19999Where 11.22.33.44 is the IP address of the server specified in the configuration file, 19999 is the standard port of the program.
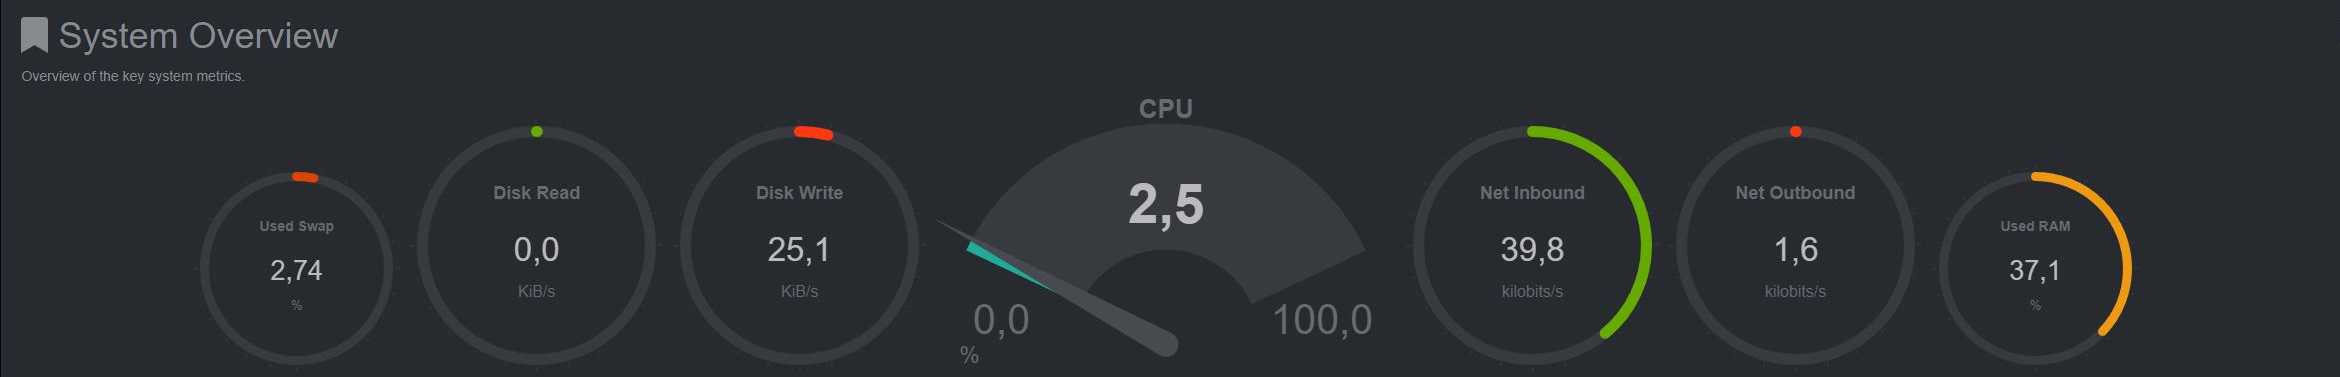
At the top of the Dashboard, the main information about the load on the server is displayed in real-time:
Below you can take a closer look at the graph of each individual component of the server:
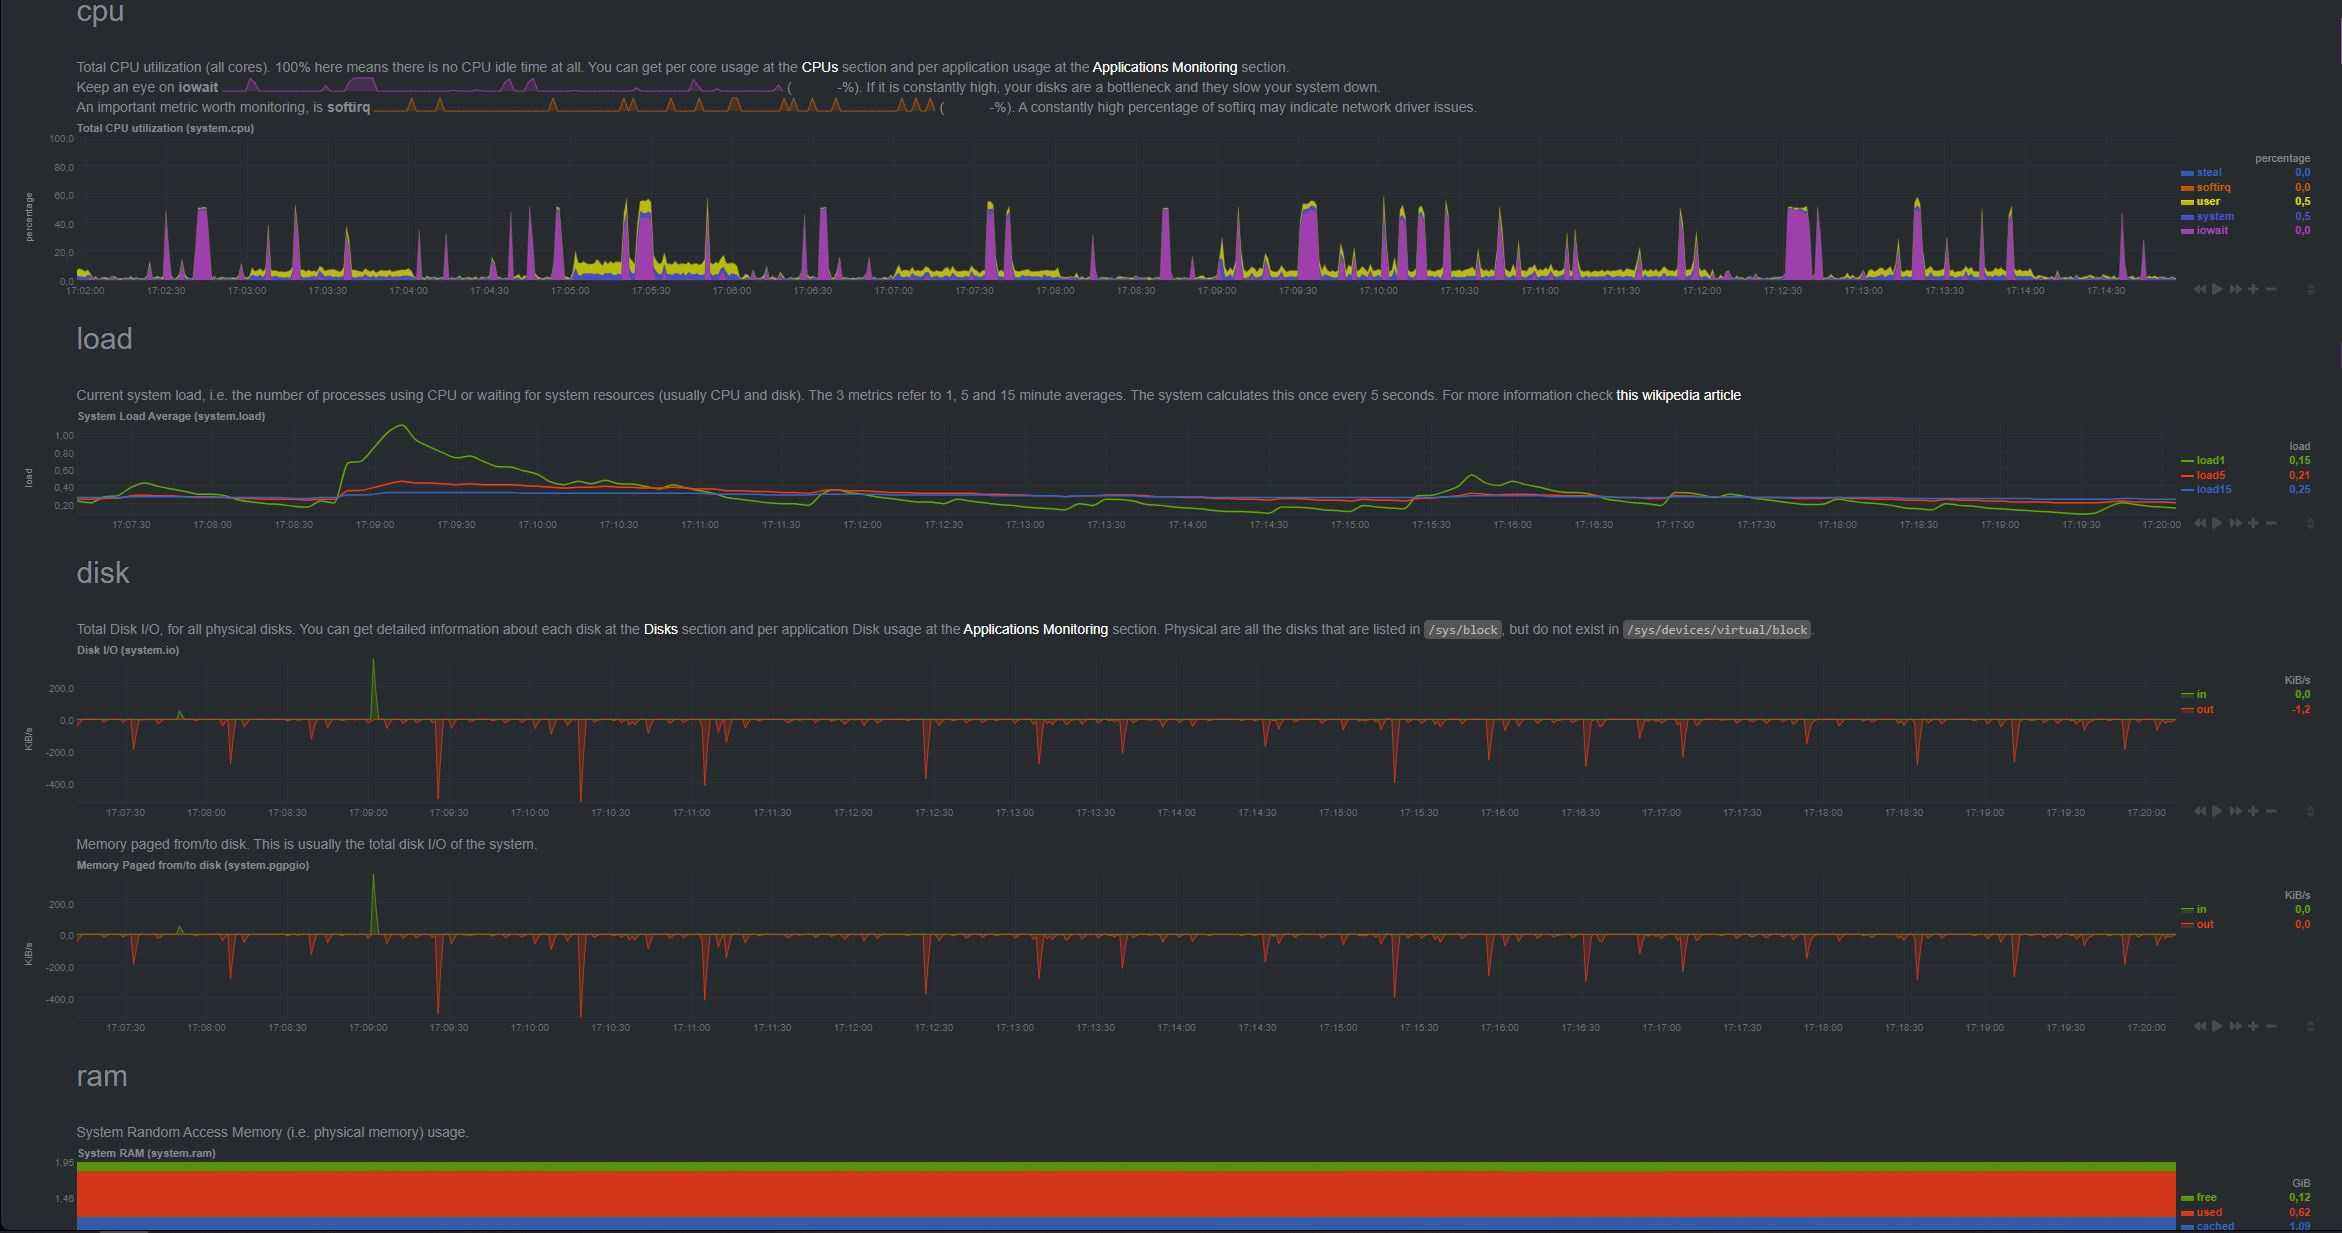
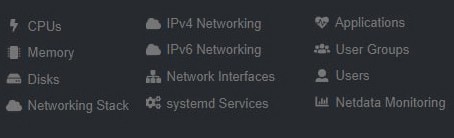
To zoom in or out of the charts, you can use the combination "Shift + mouse wheel". Once the user is familiar with the main graphs, an additional menu for each separate component located in the top right corner will automatically open. The tool is capable of providing detailed information on the following components:
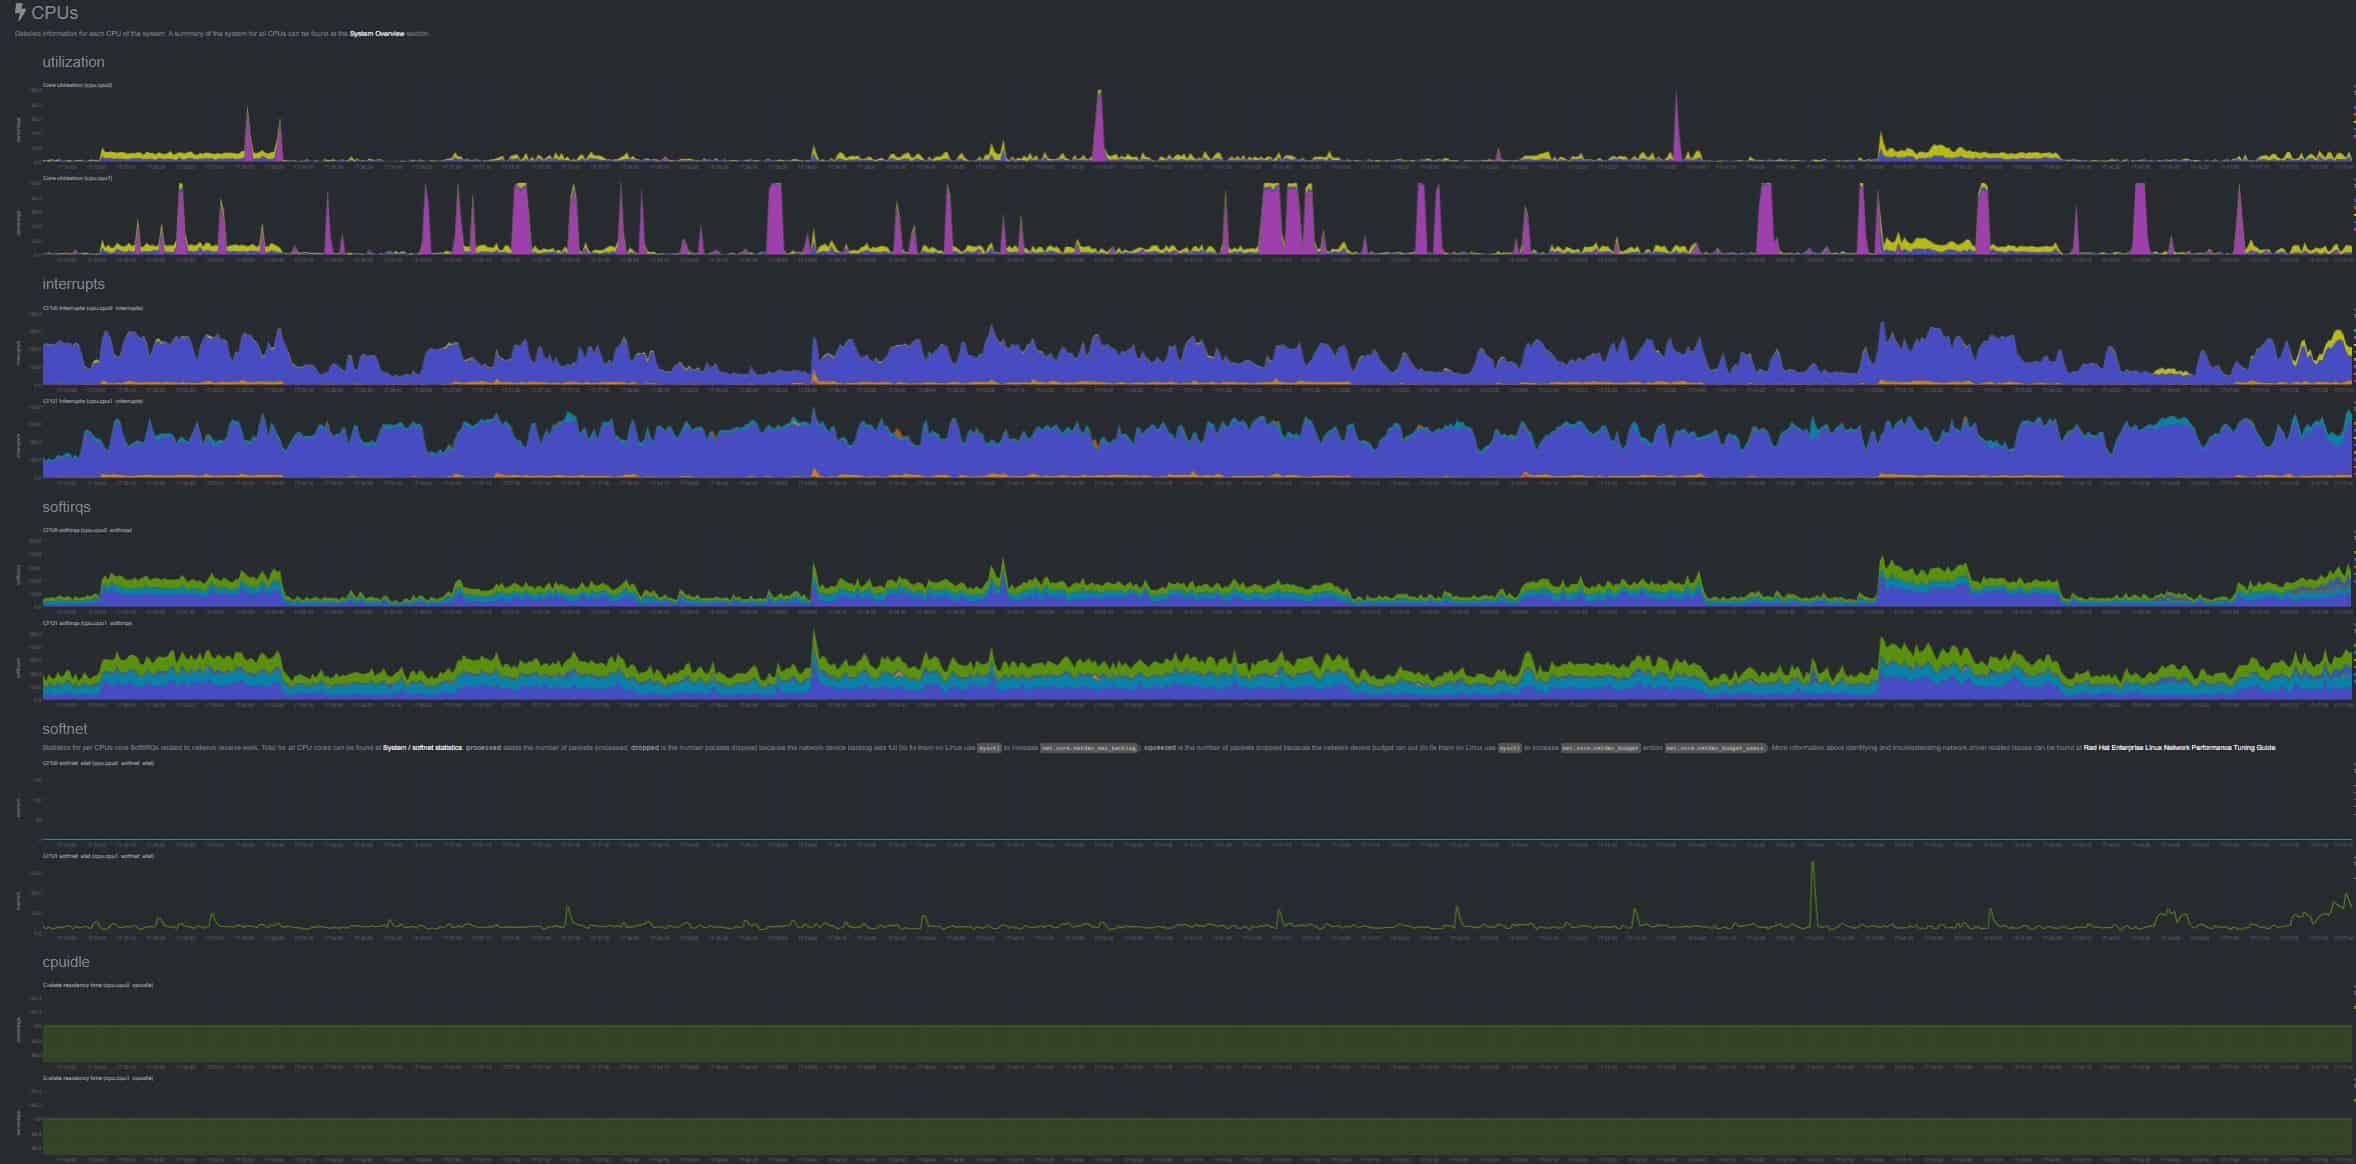
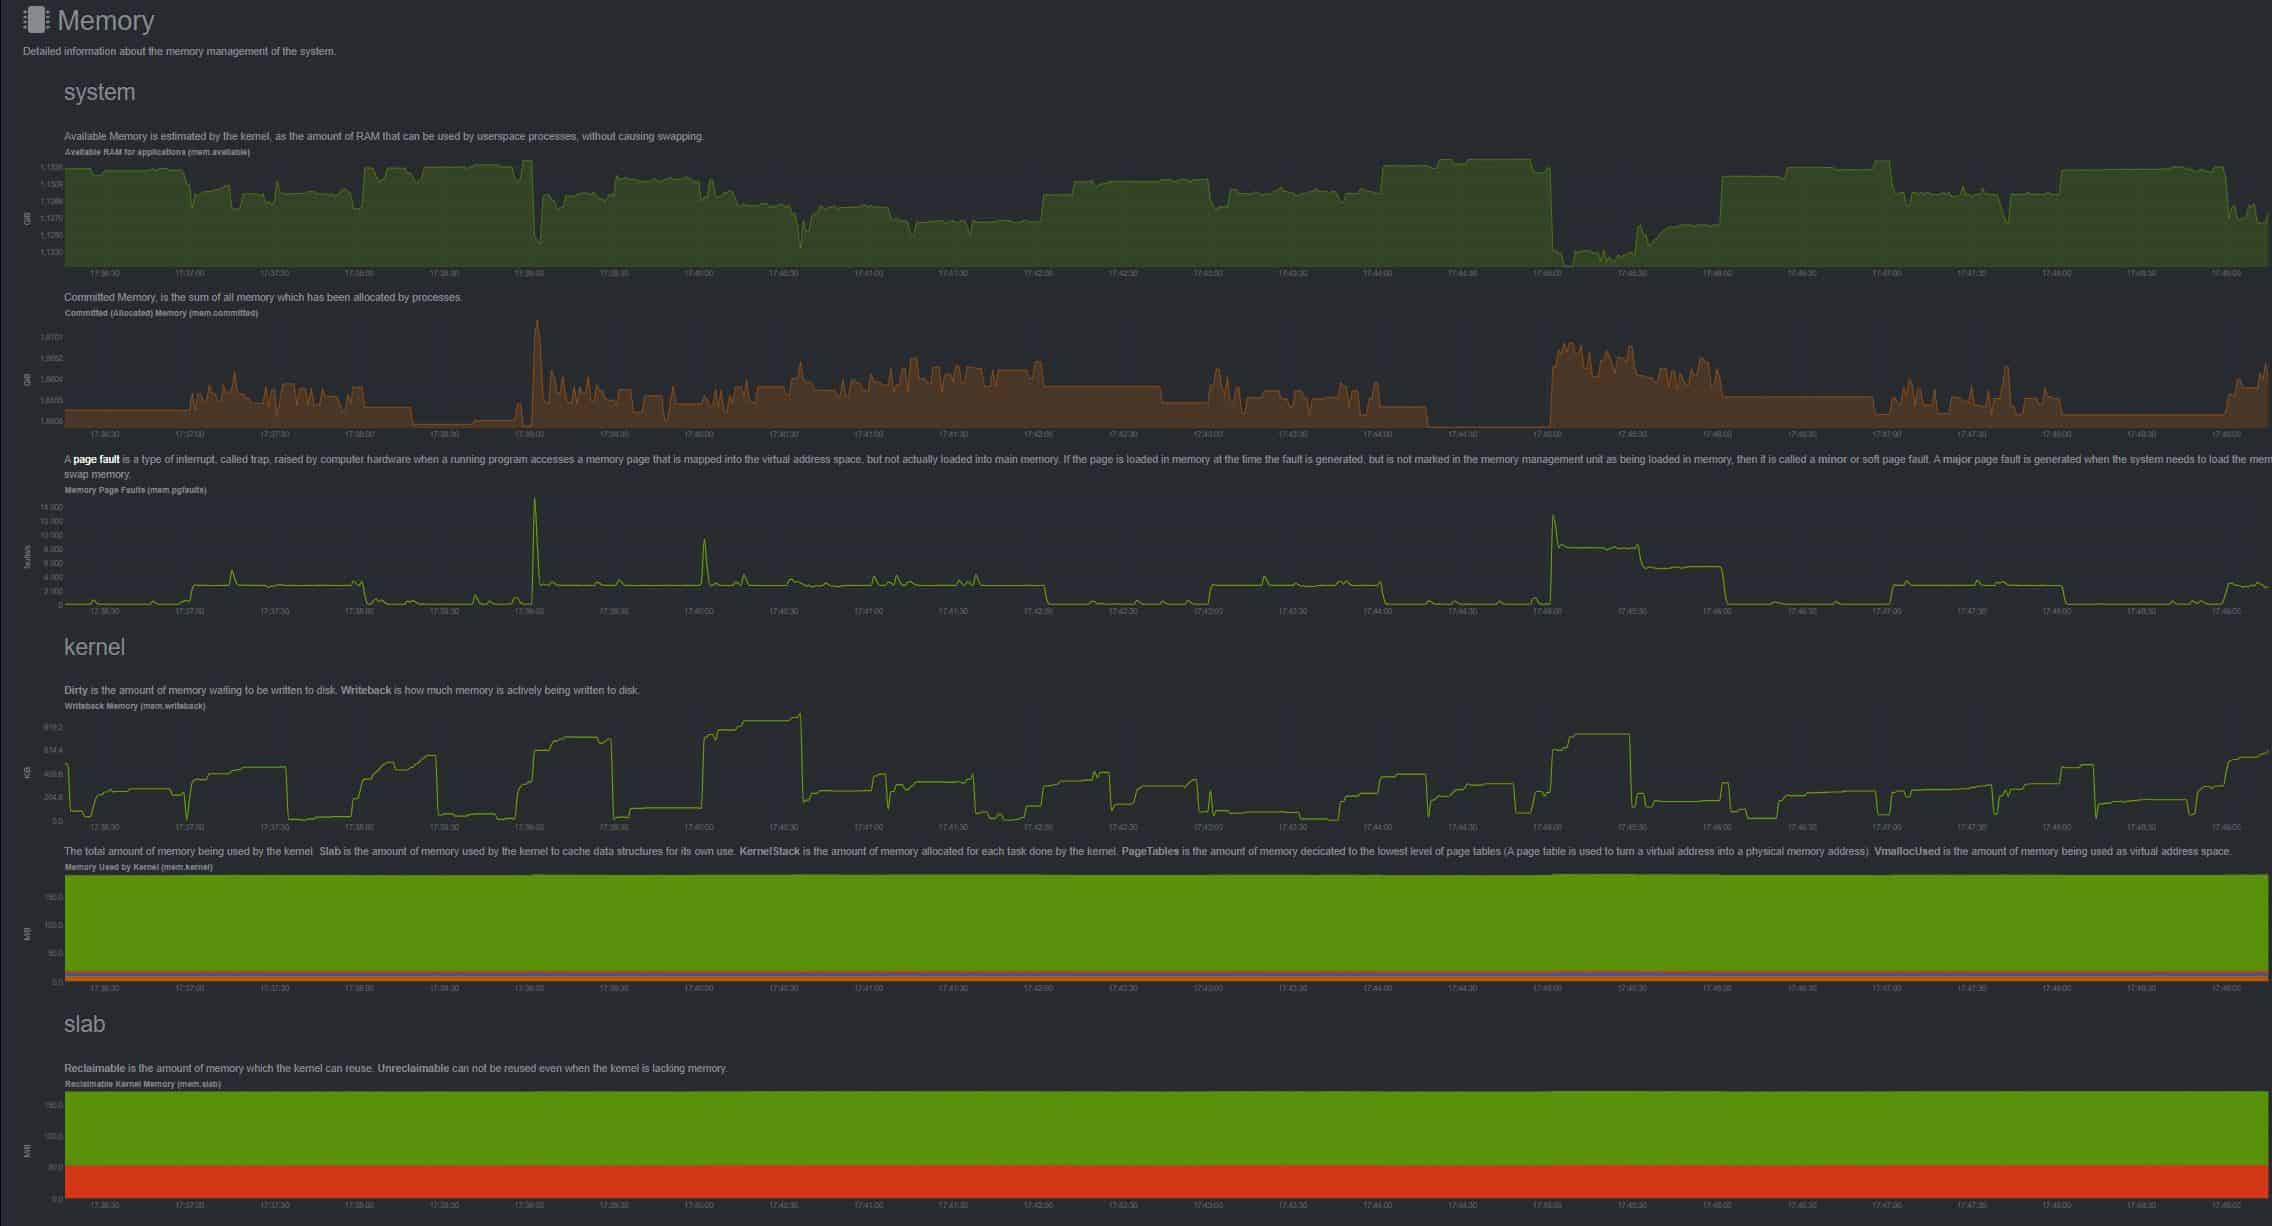
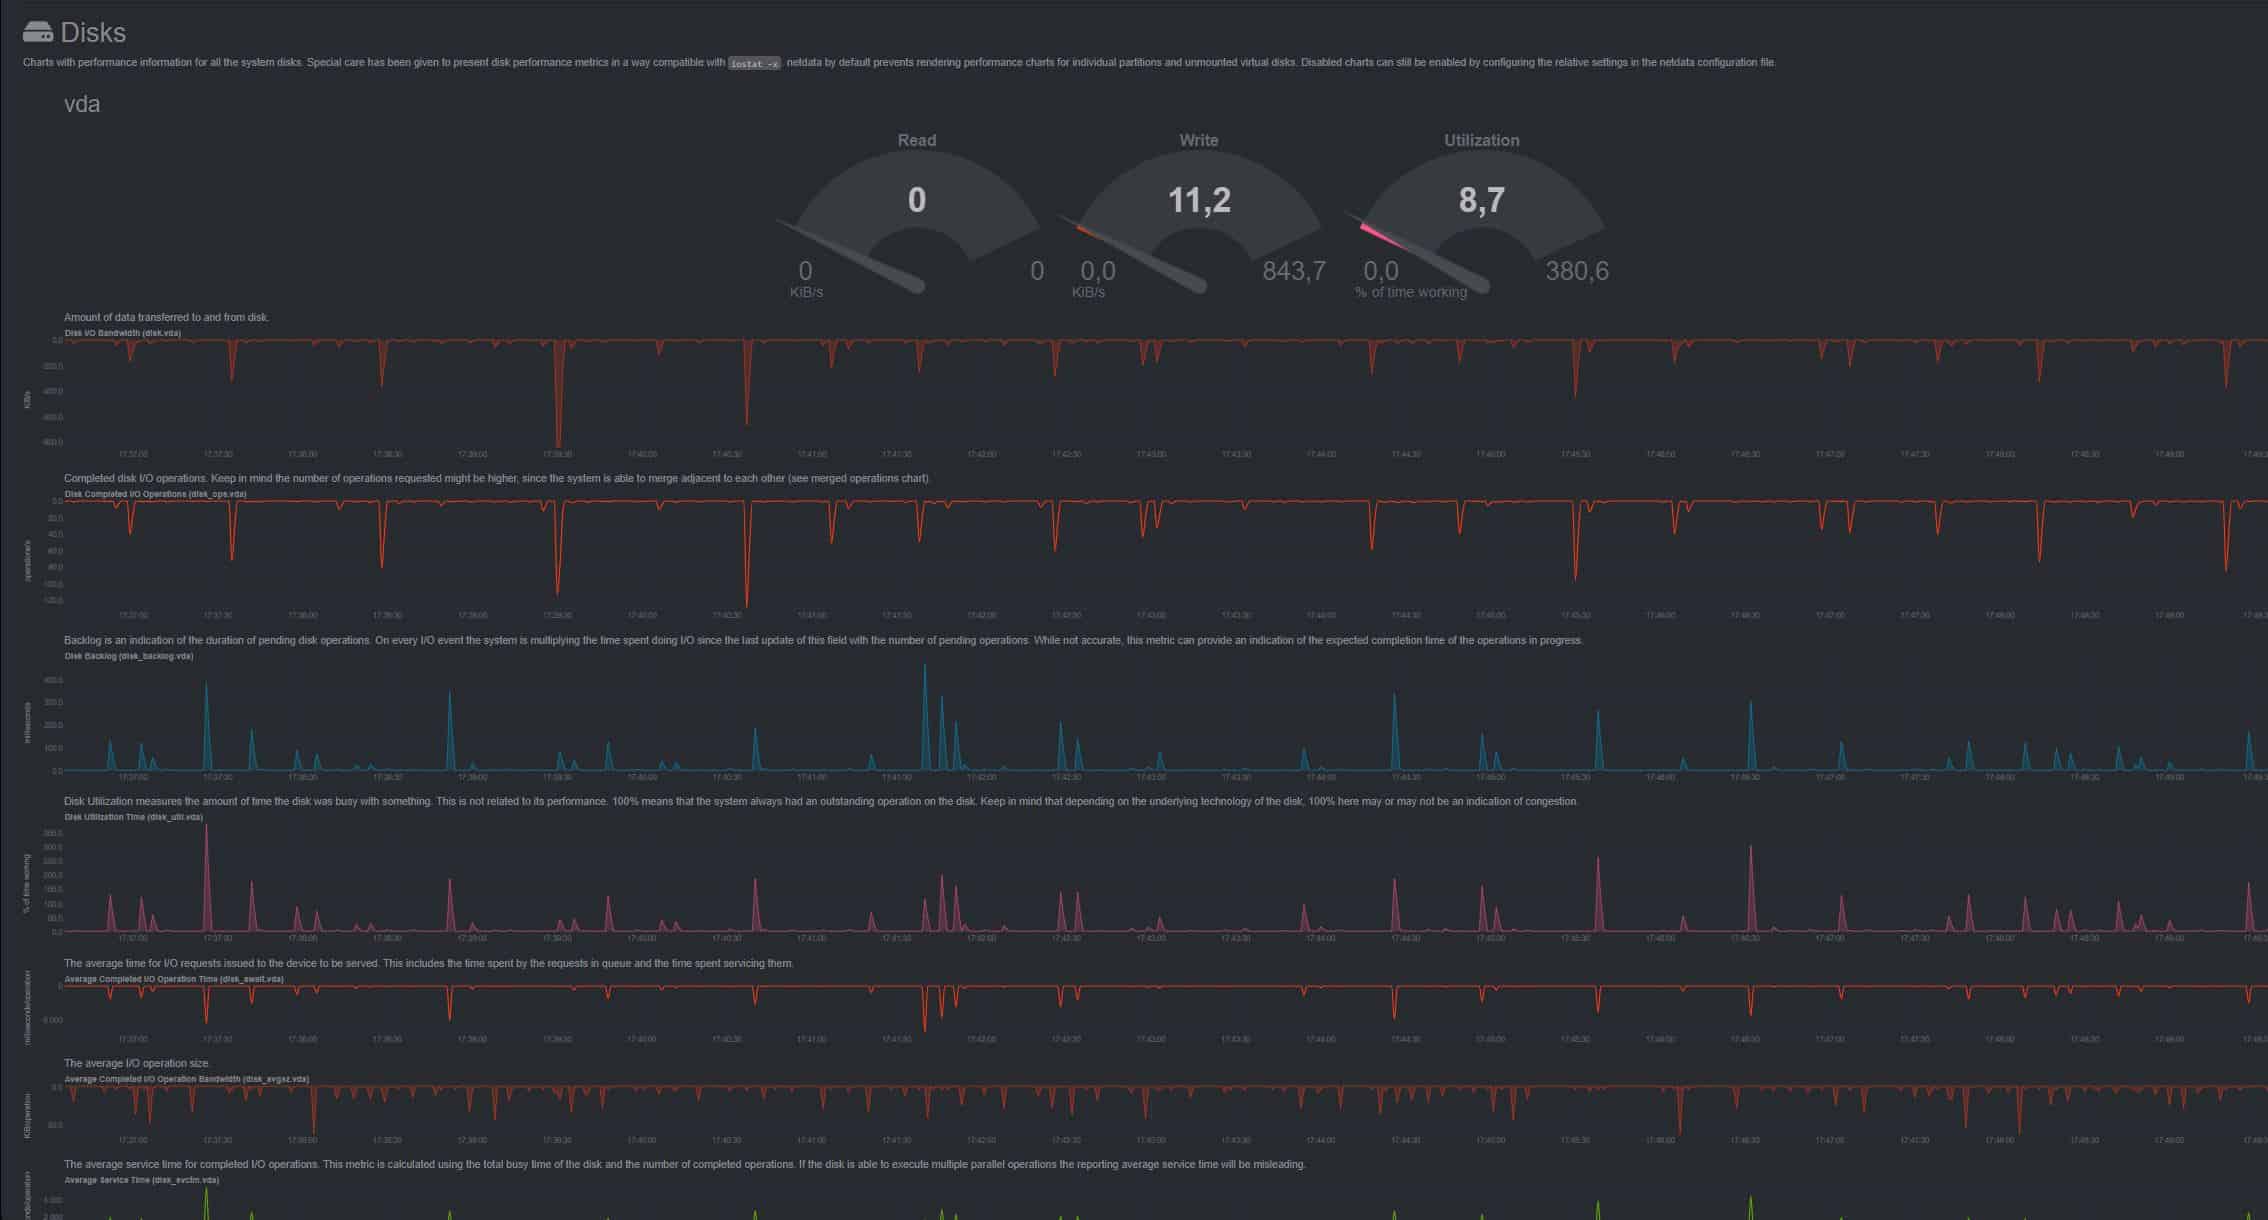
Let's consider a detailed analysis using the first three items: CPUs, Memory, Disks:
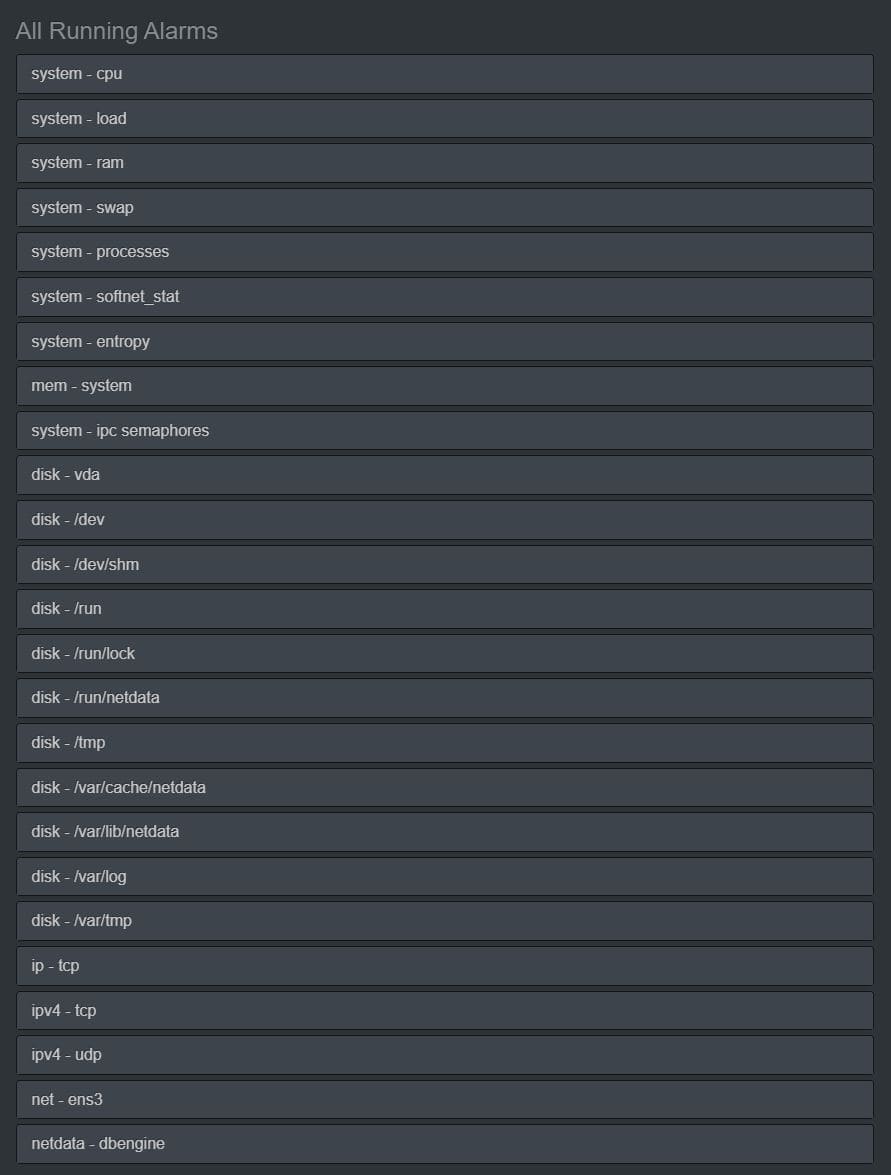
NetData also has flexible settings for alerts on specified triggers. To activate them, select "Alarm" on the top panel and choose an already prepared script from the list:
The utility's functionality is very extensive, and we recommend familiarizing yourself with the full list of possibilities on the GitHub project page or the official website. Just this one tool will be enough for complete control of the entire server in general and its individual components in particular.
Conclusion
As a result of the conducted server diagnostic, it can be asserted that the system generally operates stably and efficiently. The analysis of CPU load, memory usage, disk activity, and network load showed that the server resources are optimally utilized. However, to prevent potential problems, it is important to conduct regular monitoring of the load and prepare backup solutions to ensure reliability and performance of the server in the future.