When you face any problems with your server’s performance, the first thing you want to do is to check your Linux logs. In the system log, you can find some helpful diagnostics messages from different components of the operating system like the kernel or various services, so you’ll most likely find the failure cause there.
Every message in the log is generated in the result of certain events in the operating system: from the user, authorization to service shut-down or application failure. These events have different priorities depending on how critical they are. There are following types of events in Linux:
emerg- failure, highest priority;alert- urgent warning;crit- critical event;err- ordinary error;warn- ordinary warning;notice- notification;info- information message;debug- debugging information;
At the moment, the main logs harvesting services in Linux are rsyslog and systemd-journald. They go with most of the modern distribution packages and work independently.
rsyslog
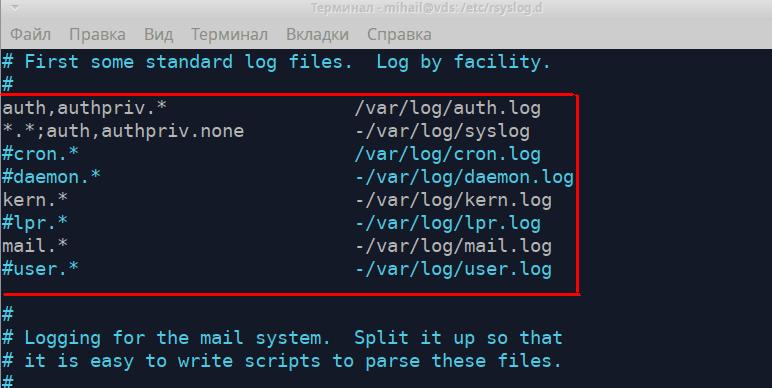
Logs of this service are located in “/var/log/” folder in the form of ordinary text files. Log messages are put in different files depending on the type of event. For instance, “/var/log/auth.log” contains information on users’ authorization in the system, and “/var/log/kern.log” contains kernel messages. Files names can differ across distribution packages, so let’s take a look at the config file to get the idea of what’s where “/etc/rsyslog.d/50-default.conf”.

These rules display which file contains each type of log messages. The left part displays the type of message in the following form “[Source].[Priority]” and the right part displays the name of the log file. While writing the type of message “*” character can be added to. It means empty value or “none” that removes it from the list. Let’s take a closer look at the first two rules.
“auth,authpriv.* /var/log/auth.log”
“*.*;auth,authpriv.none -/var/log/syslog”
The first rule means that all messages received from the authorization mechanism will be recorded into “/var/log/auth.log” file. All authorization attempts (both successful and not) will be registered in this file. The second rule indicates that all messages except ones connected with authorization will be recorded into “/var/log/syslog” file. These two files are usually the most popular. The following rules define the path to store kernel logs “kern.*” and mail service logs “mail.*”
Log files can be opened with the help of any text editor, like less, cat, tail. Let’s open the “/var/log/auth.log” file
less /var/log/auth.log
Every line of the file is a separate message received from the application or service. All messages regardless of their source have one format and consist of 5 parts. Let’s take the highlighted message in the screenshot as an example.
- Message timestamp - “Feb 12 06:18:33”
- Name of the computer that sent the message - “vds”
- Name of the application or service that sent the message - “sshd”
- Process ID - [653]
- Message text - “Accepted password for mihail from 188.19.42.165 port 2849 ssh2”
This was an example of a successful connection to SSH.
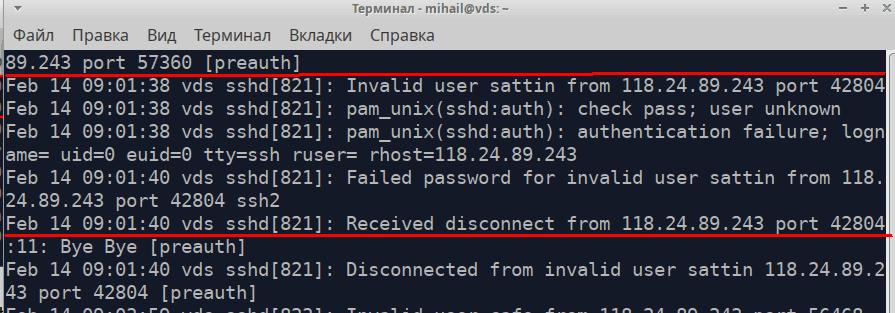
And here’s how an unsuccessful login attempt looks:

This file also records commands with advanced permissions

Let’s open the /var/log/syslog file
A highlighted message on the screenshot is the message about the network interface shutdown.

For searching for information through long text files use grep utility. You can find all messages received from pptpd service in the “/var/log/syslog” file.
grep 'pptpd' /var/log/syslog
During the diagnostics you can use tail utility that can display several last lines of files. Command “tail -f /var/log/syslog” will let you watch logs recording in real-time.
The service rsyslog is very flexible and powerful. It can be used for harvesting logs in local systems as well as on the enterprise level. You can find full documentation on the official website https://www.rsyslog.com/
Logs rotation in Linux
Log recording is happening continuously, so the size of the files constantly grows. Rotation mechanism ensures automatic archiving of old logs and the creation of new files. Depending on the rules, it can happen daily, weekly, monthly or by size limit. As new logs are created, old ones can be just deleted or sent by email. Logs rotation is performed by logrotate utility. You can find the main configuration in “/etc/logrotate.conf” file. Files content is also processed in “/etc/logrotate.d/” folder
New rules can be logged into the main config file. However, it’s best to create a separate file in “/etc/logrotate.d/”. By default, there are a few files in this directory

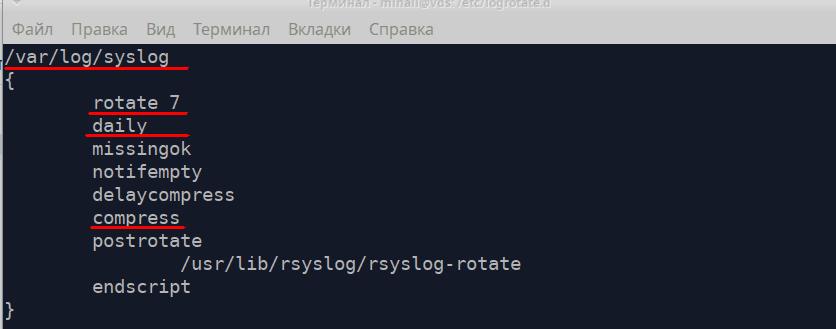
Let’s take a look at the file “/etc/logrotate.d/rsyslog" that contains rotation rules for logs of the rsyslog service.

First, the rule should contain the path to the log file and then go all guidelines in curved brackets.
- rotate 7 - number of files to keep - 7
- daily - create a new file every day
- compress - compress and archive old files

You can see on the screenshot that in the “/var/log/” folder there are the main log “syslog” and 7 archives, which corresponds with the rules in the config file.
You can find a more detailed description of logrotate in the manual, executing the “man logrotate” command
Collecting Linux logs - journald
Logs harvesting service systemd-journald is a part of the initialization system systemd. Linux log files are stored in “/var/log/journal/” in a special format and can be opened with the help of journalctl utility. Records format is exactly the same as in rsyslog.
Command journalctl with no attributes shows all records but it’s not suitable for bigger logs. Let’s take a look at some options of this utility.
journalctl -b- show all records since the last startjournalctl -S "2020-02-17 12:00" -U "2020-02-17 12:10"- show record within a certain time periodjournalctl -u pptpd- show records of a certain servicejournalctl -k- show kernel messagesjournalctl -p err- show messages of a certain priority, higher priority messages in this case(crit, alert, emerg)journalctl -f- show messages in real-time
For better flexibility you can combine these options. Let’s show all errors of the pptpd service
journalctl -u pptpd -p err
If you specify the path to the executable file as an attribute the utility will show all messages sent by this file. Let’s show all messages sent by the file “/usr/bin/sudo” since 04:15 on February 18, 2020. In fact, it will show all commands executed with higher permissions.
journalctl -S "2020-02-18 04:15" /usr/bin/sudo
To find out how much disk space log files take up to execute the following command
journalctl --disk-usageIn order to limit the log file to 1Gb execute the following command
journalctl --vacuum-size=1GOpening binary files
Now let’s take a look at some special files in the “/var/log/” folder where all login attempts are stored. These files are binary and can be opened with special programs only.
/var/log/wtmp contains information on successful login attempts. Use last utility to open it.

/var/log/btmp - contains all failed login attempts. It can be opened with lastb with advanced permissions. Attribute -n defines the number of lines displayed from the end of the file.

/var/log/lastlog - contains the time of the last login action for every account record. It can be opened with lastlog
